S&P 500 Market Outlook for 2026
Got a question about the markets, your investments, or a topic you’d like us to discuss in an upcoming article? We read every message and may feature your question in our daily write-ups!
Email: andrei@signal-sigma.com
Follow & DM on X: @signal_sigma
First of all, I would like to start off this week by wishing you all a blessed, happy and prosperous New Year! Thank you for your readership and patronage! We’re looking forward to spending another year working together, building better portfolios and stock market strategies, as well as updating the Signal Sigma app in a few key areas! If enough of you choose to subscribe, we’ll be able to deploy even more awesome new features into production, so spread the word if you’re enjoying this service! Much appreciated 🙏
2026 will be a year with a focus on education, guides and - most importantly - more flexibility in custom strategy creation. That being said, let’s review the market action in 2025.
Markets finished the year on a high note, despite volatility across asset classes. The S&P 500 put in a solid performance, up +16.4% and marking its 3’rd consecutive year in the green. Leadership was provided by the Nasdaq, which rose +20.4%, reflecting risk appetite in the AI space and growth stocks. The Dow Jones and Russell 2000 lagged, closing ~13% higher, but still providing a solid return driven by industrials and financials.
The bulk of returns occured after the April “Liberation Day” market decline. Investors were initially concerned about the inflation impact of tariffs, but that was proven to be a false fear. Instead, CPI slowed materially in the back half of 2025, allowing the Fed to pivot toward a more dovish and supportive stance. Treasury yields fell sharply, reversing the initial rise. Expectations for further easing remains high at the moment, fueling the increase in equity valuation multiples as well as bond prices.
Global risk assets had a banner year, reversing the recent trend of underperformance versus U.S. equities. The MSCI All Country World Index ex-U.S. gained more than +30%, outperforming all U.S. benchmarks. Foreign markets benefited from a weaker dollar, improving inflation and easy monetary conditions. China slightly lagged due to weakness in the property sector and a trend of capital outflows.
The international outperformance will likely reverse this year, as dynamics change - growth should slow in foreign economies while it picks up in the U.S. and the USD rallies simultaneously.
The biggest story in 2025 was likely the metals complex, specifically Gold and Silver. GLD gained +61%, while SIL recorded a +155% increase, outpacing equities, bonds, and even most cryptocurrencies. Speculation and leverage abounded. Various narratives circulated but inflation hedging was simply not it. The reality is that options, trend-following and leverage created an excess level of demand that now put metals in a position of a sharp reversal, especially if inflation continues to decline.
The bond market also finished the year with modest gains, driven by stable credit spreads and tame inflation.
Commodities outside of gold traded range-bound, but underperformed overall. Slowing global demand and higher-than-expected supply dragged oil lower, the main underlying component of DBC.
Cryptos notably underperformed, with all major tokens outside of BNB and TRX recording a negative result. Some even finished -60% or more in 2025. The average return for a diversified crypto portfolio was -29%, speaking to a muted risk appetite in speculative assets.
Overall, 2025 was a year of resilient financial markets, tested early on by a “flash crash” followed by a V-shaped recovery. With all of the risks flagged by the media and institutions (inflation, geopolitics, Fed mistakes, etc.) risk assets came through and delivered. If inflation follows a steady path lower allowing the Fed to proceed with a more accommodative stance, the setup into 2026 remains constructive.
Recap done. Let’s see where we stand.
The final trading week in 2025 saw the S&P 500 close modestly lower, losing momentum. The “Santa Claus Rally” failed, and the decline broke a 3-week continuous advance. The Santa Claus rally is normally observed in the final 5 trading days of December + first 2 days of January. It serves as a short term sentiment gauge, with the S&P 500 posting higher years roughly 75% of the time. When absent, forward returns tend to weaker as per the original adage:
"If Santa Claus should fail to call, bears may come to Broad and Wall."
As with every such indicator, they should be taken with a grain of salt, since 2025 also had a negative Santa Claus rally which did not deter an otherwise great performance for the year.
Technically speaking, SPY remains above support at the 50-DMA and M-Trend levels ($675), though it has recently triggered a negative MACD crossover. Dark Pools were net sellers in the first session of the year, while GEX has flipped negative in both the short term and in the aggregate. Stocks might be somewhat pressued early in 2025 by the looks of it.
We have adjusted the chart below for a $770 Price Target by year-end as well as a 22% CAGR slope for the trading channel, fitting for the recent history. Meaningful resistance should be encountered at around $713 (R1), while downside (as well as a fine entry point) would be around $635 (S1).
Trading volume into year end was thin, typical for a holiday period. Lighter than normal volume is expected until the middle of the month, as many traders and investors will still be in “holiday mode”. However, a lack of a year-end push higher typically translates into a more selective market entering 2026. In other words, we may experience higher than normal volatility, especially if the other 2 seasonal indicators fail to hold up:
The First Five Days of January - When the S&P 500 rises in the first five days, the full year has shown an average gain of around 14% with roughly 83% accuracy;
The January Barometer - When January is positive, the full year has been positive ~80–86% of the time, with significantly higher average annual gains (often 14–17%). When January is negative, the year is far more mixed;
The context for January 2026 is that the S&P 500 has posted monthly gains for 8 consecutive periods (the last down month being April 2024). As such, a down-month is becoming increasingly more likely. Overall, the market is still consolidating those massive gains from the April lows, with 6.900 acting as a temporary ceiling on prices. A decisive breakout above 6.900 would most likely lead to a decisive breakout and reassert bullish control.
If volatility remains contained, odds of this breakout happening increase. A potential issue here is that investors have become increasingly complacent about above average returns. Consider the recent streak of yearly performance form the benchmark equity index:
2019 +31.2%
2020 +18.0%
2021 +28.5%
2022 -18.0%
2023 +26.1%
2024 +24.9%
2025 +17.8%
We have personally counseled self described “risk-averse” clients which targeted returns of 10% - 12% for their portfolios looking forward (an annual cagr of 10% comes with a significant dose of risk-taking). While recent returns have been great, they cause expectations to go up into unrealistic territory and become detached from underlying economic growth. In other words, odds of disappointment increase, proportional with stellar recent returns.
So what do options traders think? As far as the top 10 stocks in the S&P 500 are concerned, the outlook is certainly getting brighter. The potential for long term upside (6 months - 1 year out) is starting to increase, despite prices also trending higher. As can be seen in the chart, upside is expected to decrease as prices rise (logically) so it’s encouraging to see rising prices being accompanied by non-declining upside.
On the downside, we’re seeing less medium term protection being required (1 - 6 months out). This is usually where most professional investors hedge single-stock exposure, so it’s bullish to see less implied downside, despite prices slowly trending higher.
Short term downside has dramatically increased, but we would point to a seasonal quirk here that sees hedging demand in December January and May.
Overall, traders see a +25% appreciation potential for market leading stocks, implying a $850 price target for SPY by 2026 year-end.
Does that seem far fetched? Perhaps, but not by much, if we’re going by sell-side analysts. As of this writing, Wall Street analysts are in a bullish mood. Many strategists expect the U.S. stock market to extend its rally into another year, with the central Wall Street banks highlighting several drivers supporting continued upside. Oppenheimer is the most optimistic, with a target of 8.100 for the S&P 500, not far from the options-implied upside for the leading stocks.
Yardeni Research forecasts a more temperate 7.700 target (+11.5%), along with many other peers in the same range. BofA retains its conservative view, but all sell-side analysts believe 2026 will be a positive year.
Goldman Sachs forecasts that S&P 500 EPS will accelerate in 2026, rising 12% from 2025 levels. This forms the basis of the bullish thesis. They see opportunities not just in prominent technology names, but also across cyclical sectors such as small caps, non-residential construction, and consumer stocks exposed to the middle-income consumer (intriguing!).
Global growth is also expected to accelerate (+2.8% to global GDP), which is higher than consensus expectations. Growth in China is also believed to firm, broadening the appeal for stocks. Morgan Stanley published a more tempered outlook, suggesting that U.S. equities will outperform global peers.
There are valid reasons why, regardless of the firm, a bullish outlook is supported:
Accomodative monetary policy - rate cuts within an established bull market usually leads to better results;
Robust earnings growth for all sectors, not just mega-caps and AI-related firms; in theory, technological adoption and operational leverage should help companies expand margins;
Sector and Style participation; many analysts see more upside in cyclicals, financials and industrials going forward, broadening the rally beyond a handful of names;
2026 should help consolidate gains across the market, according to earnings expectations. Magnificent 7 growth rates are seen to remain stable, while the “rest 493” — and indeed the Russell 2000 — should see earnings boom.
The chart below details S&P 500 median EPS (right-axis) and SPY ETF on the left. Notably, there is a TON of room for improvement when it comes to EPS growth, as the average S&P 500 constituent has only grown EPS by 60% since 2019, while the headline index rose 174%.
The difference is made up by expanded multiples. Which brings us to the bearish counterpoint.
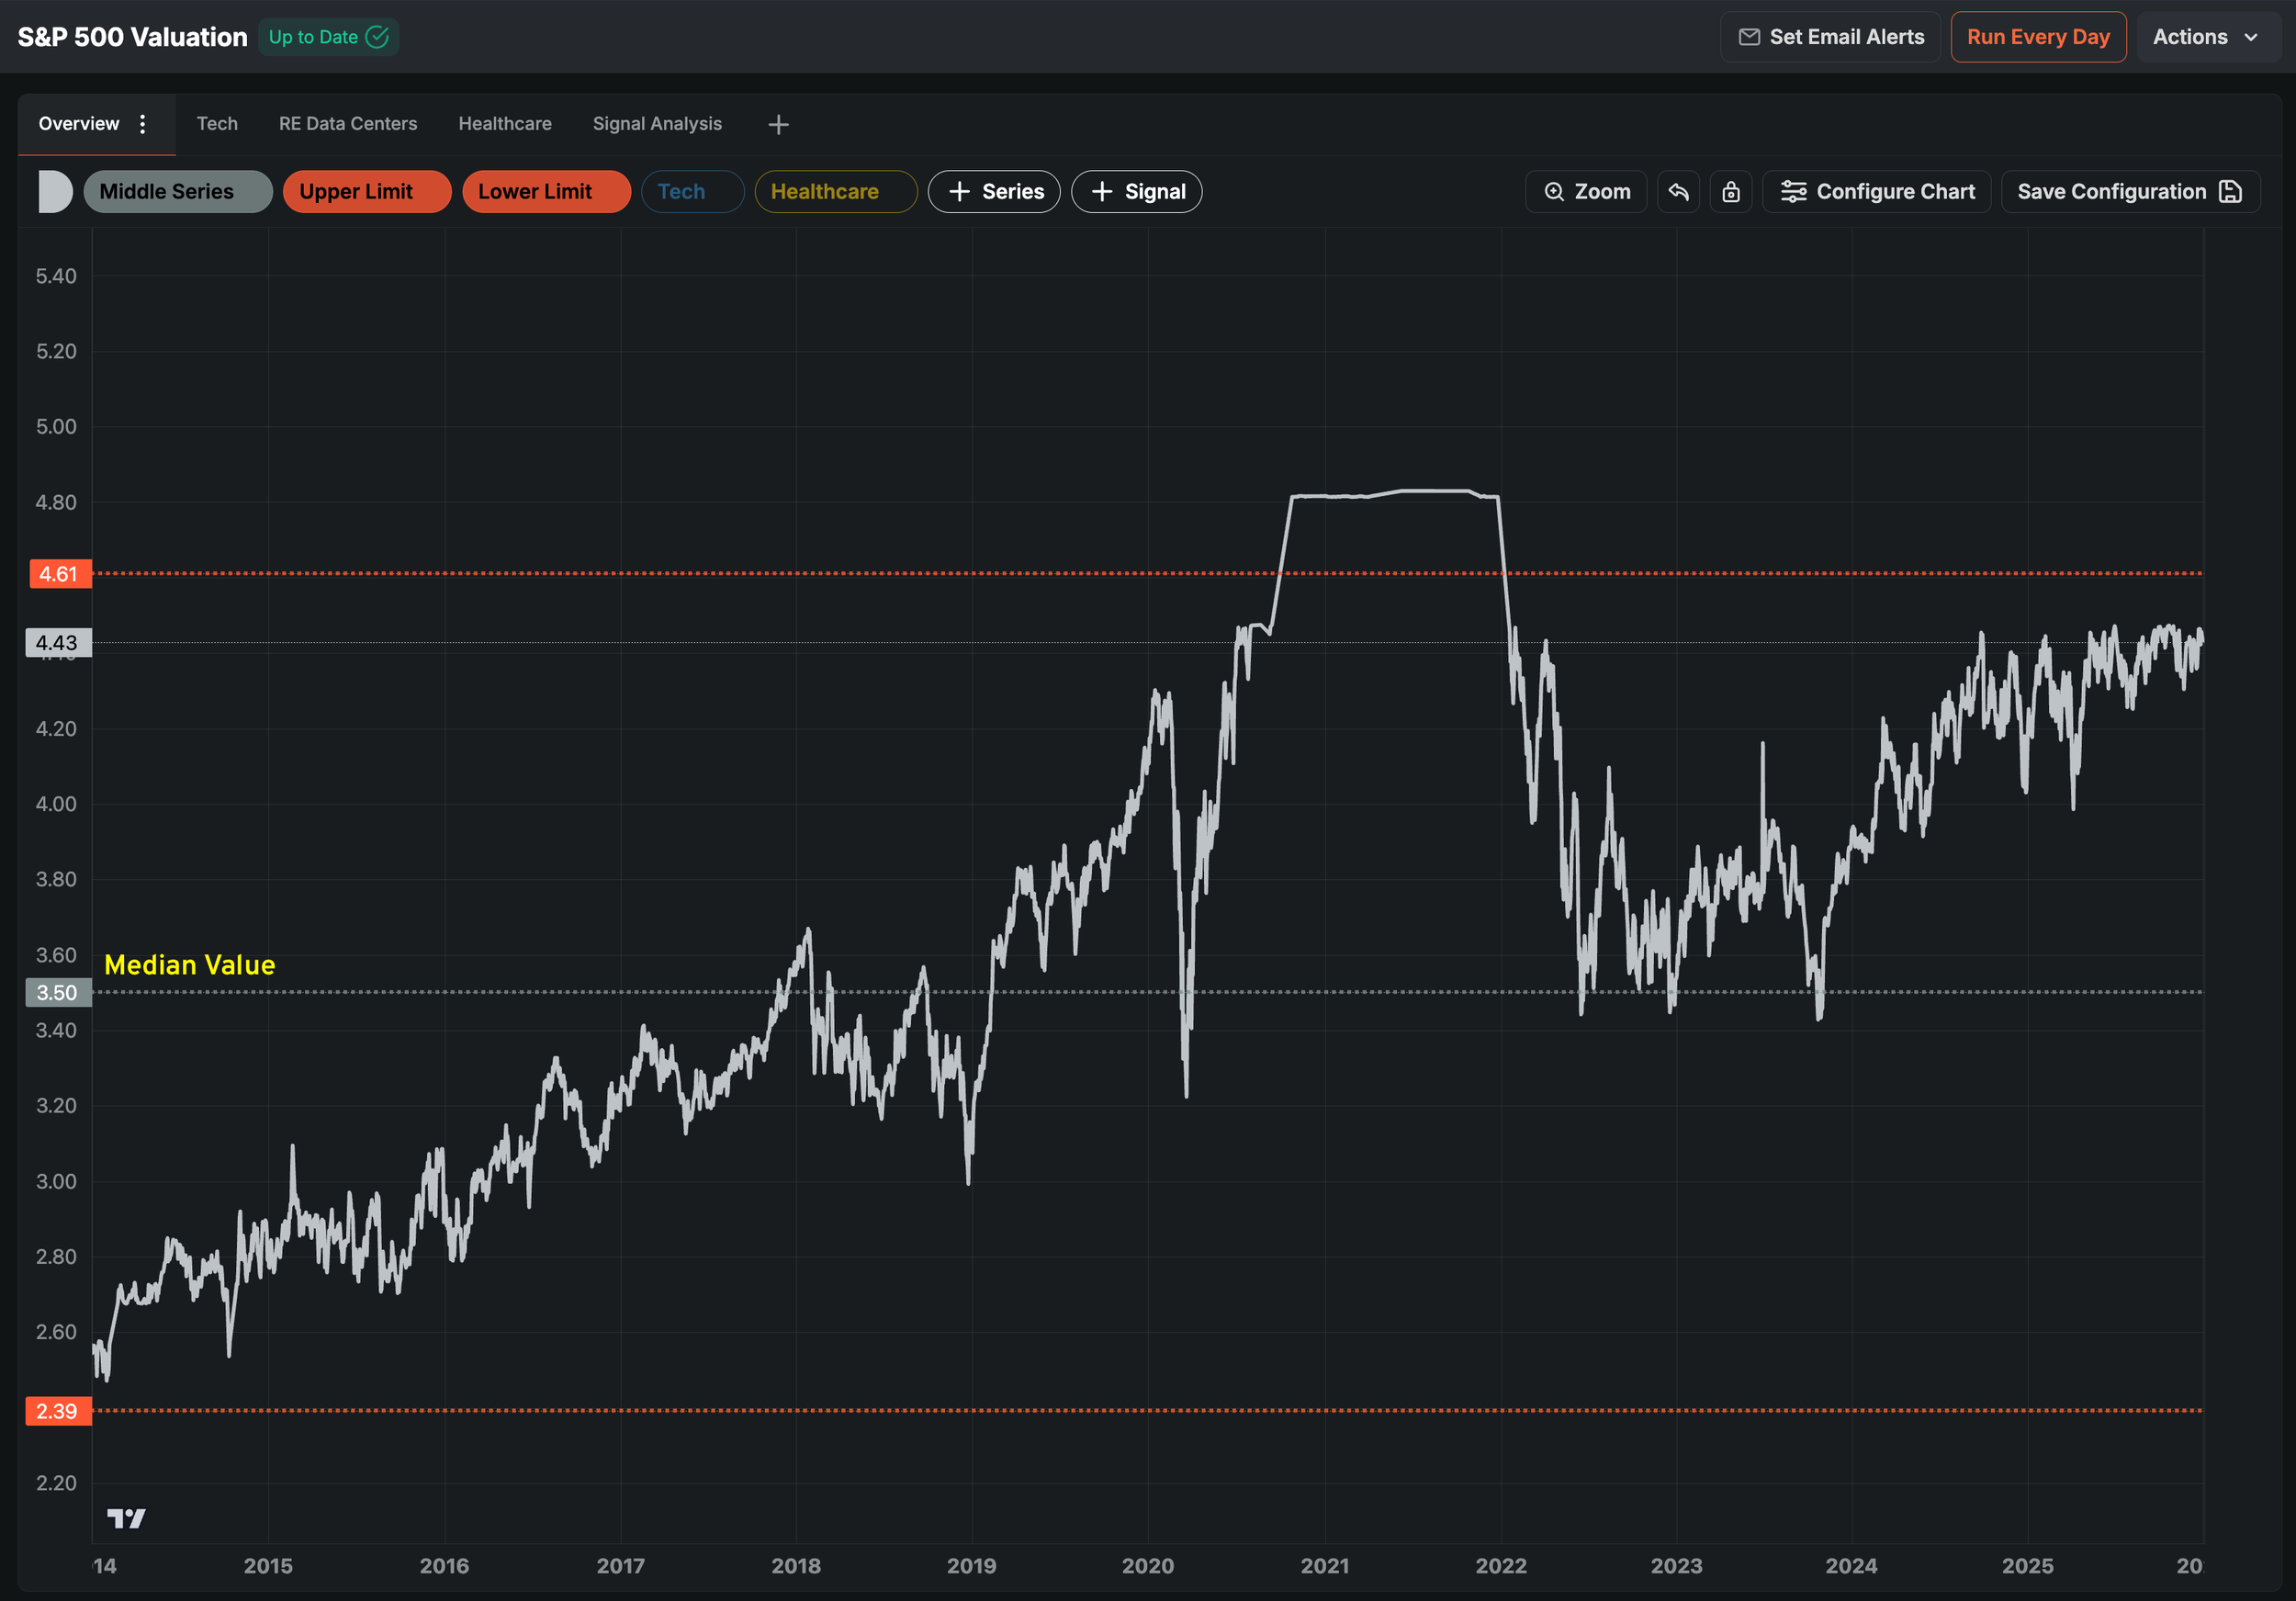
Under normal circumstances, a 60% growth in EPS should equate to a roughly 60% rise in the average index price. The gap between the index price and the actual EPS growth translates into multiples which are sitting close to the cycle high (4.4 EV/Sales).
While valuations are terrible market timing devices, they are representative of investor sentiment (very bullish). This leaves little room for error, as further valuation expansion becomes less and less a driver of stock market returns. If earnings growth does not materialize as expected, stocks will struggle, as valuations adjust downwards, even in a non-recessionary environment.
A more concerning factor is cooling inflation which could reflect a slowdown in demand, rather than success from Fed policy. The market wants to see lower inflation in tandem with persistent growth and continuing rate cuts. Yet that is a historically rare occurrence. There is an interdependence between economic growth, earnings growth and inflation which should not be dismissed. The Fed is continuously walking a tightrope, as the aim is to cut rates while simultaneously lowering inflation. If a disconnect rises in this relationship (higher than expected inflation), the Fed might need to tighten conditions and hinder growth as a consequence.
Bears also focus on geopolitics, trade frictions and credit stress as other top concerns. The full laundry list of concerns is laid out in the chart below, courtesy of Deutsche Bank.
Our Trading Strategy For 2026
If there’s a real risk for this year, it’s most likely not one mentioned above. After all, when investors are monitoring risks, they are hedging or preparing to mitigate downside to a certain extent. As such, the risks discussed in this article are most likely already priced in.
The real problems arise from those factors no one is expecting to become an issue. Last year, it was tariffs which were the "surprise factor” and forced the market to reprice. Same with the COVID pandemic. In a similar way, a significant risk is something we’re not currently seeing or predicting.
Our best guess is that markets will continue to rise, albeit in a more volatile and unpredictable fashion, primarily due to supply and demand + technical considerations. We may see fits and bursts punctuated by sideways consolidation, occasional significant drawdowns followed by aggressive rallies. Ultimately, odds are still that the market will finish 2026 higher than it started, going by most metrics that we follow.
Our goal is to be more diversified across sectors and factors, drawing from all available and outperforming models. We’ll also focus on mid and smaller cap firms in our stock selection process. Due to the more volatile and bi-polar nature of the market, we won’t do a lot of active asset allocation changes barring major events or stop-loss triggers.
For now, we will maintain a bullish stance, as there is no evidence of anything major “going wrong”, despite real risks being present. We’ll keep our expectations balanced for the year ahead as we tend to agree with street analysts predicting a 7.700 price target for the S&P 500.
A worst case scenario using these assumptions translates into a 6.900 year-end finish, while 8.500 stands at the very high end of optimistic outcomes.
Disclosures / Disclaimers: This is not a solicitation to buy, sell, or otherwise transact any stock or its derivatives. Nor should it be construed as an endorsement of any particular investment or opinion of the stock’s current or future price. To be clear, I do not encourage or recommend for anyone to follow my lead on this or any other stocks, since I may enter, exit, or reverse a position at any time without notice, regardless of the facts or perceived implications of this blog post. I currently do not own or plan to own any position, long or short, in the securities mentioned.
I am not a financial advisor licensed in the United States. Nor am I providing any recommendations, price targets, or opinions about valuation regarding the companies discussed herein. Any disclosures regarding my holdings are true as of the time this article is written, but subject to change without notice. I frequently trade my positions, often on an intraday basis. Thus, it is possible that I might be buying and/or selling the securities mentioned herein and/or its derivative at any time, regardless of (and possibly contrary to) the content of this blog post.
I undertake no responsibility to update my disclosures and they may therefore be inaccurate thereafter. Likewise, any opinions are as of the date of publication, and are subject to change without notice and may not be updated. I believe that the sources of information I use are accurate but there can be no assurance that they are. All investments carry the risk of loss and the securities mentioned herein may entail a high level of risk. Investors considering an investment should perform their own research and consult with a qualified investment professional.
I wrote this blog post myself, and it expresses my own opinions. I do not have a business relationship with any company whose stock is mentioned in this blog post. The information in this blog post is for informational purposes only and should not be regarded as investment advice or as a recommendation regarding any particular security or course of action.
The primary purpose of this blog post is to share industry expertise and research and receive feedback (confirmation / refutation) regarding my investment theses.