/ June 08 / Weekly Preview
-
Monday:
N/A
---
Tuesday:
Existing Home Sales (4.06M exp.)
---
Wednesday:
Inflation Rate YoY (4.2% exp.)
Core Inflation Rate YoY (2.9% exp.)
---
Thursday:
PPI MoM (0.7% exp.)
Initial Jobless Claims (219K exp.)
---
Friday:
Michigan Consumer Sentiment Prel (46 exp.)
-
Monday:
N/A
---
Tuesday:
N/A
---
Wednesday:
Oracle Corporation
Chewy, Inc.
---
Thursday:
Adobe Inc.
Lennar Corporation
---
Friday:
N/A
Momentum Takes A Breather
Got a question about the markets, your investments, or a topic you’d like us to discuss in an upcoming article? We read every message and may feature your question in our daily write-ups!
Email: andrei@signal-sigma.com
Follow & DM on X: @signal_sigma
The momentum based market melt-up finally took a breather last week. Following a historical 9 straight weeks of wins, the S&P 500 closed lower, finishing Friday at 7,384, down about 2.6% on the week and roughly 3% below Tuesday’s record high of 7,609.78.
The real story consists of a very sharp rotation between Factors. Tech, Growth, AI, small caps, momentum and emerging markets all took a sizable hit, while the Dow Jones and the Equally Weighted S&P 500 barely finished lower on the week. The Value factor (IVE) was also spared the bloodshed. As such, we would classify the price action as “rotation”, not “breakdown”.
The initial trigger for the decline was Broadcom. After Wednesday’s close the AI-chip bellwether reported better-than-expected earnings but projected next-quarter AI revenue below Wall Street’s elevated expectations, and CEO Hock Tan chose not to raise the full-year guidance. The stock plunged about -14% on Thursday, pulling the Philadelphia Semiconductor Index down -5.21% and weighing on peers including AMD, Intel, and Micron.
From a macro standpoint, Fridays Non-Farm Payrolls delivered job growth of around double what economists expected (172K new jobs vs 85K expected). Unemployment held firm at 4.3%.
The market chose to interpret this as “bad news”, on account of the bond market reaction.
The 10-year Treasury yield climbed to 4.53%, its highest level since May, the 30-year reclaimed the 5% mark, and expectations for a 2026 rate cut have dissipated. Markets now price out any cuts this year, and several strategists — including Deutsche Bank’s Henry Allen — believe a rate increase is now more likely than not.
Our view here is that inflation is heading lower from a structural standpoint rather than higher. Once the base effect from the energy crisis is taken out of the equation, factors such as technology and AI will continue to increase productivity at the expense of job growth. Remember the Citrini Research article from the start of the year? The one arguing that AI will fully replace entire middle-management departments and cause widespread job losses? The market also panicked during that episode, which forecasted lower jobs numbers.
In any case, the cross asset tape held together relatively well given the damage recorded in the Technology - Growth - High Beta trade. Gold (-5% on the week) and Bitcoin (-17% on the week) were also notable laggards, driven lower by the higher yields narrative and waning price momentum in both assets.
Yet the VIX did not jump dramatically, a sign the selling was rotational rather than systemic. 7 out of 12 sectors logged positive returns throughout the week: Energy (XLE), Healthcare (XLV), Real Estate (XLRE), Financials (XLF), Staples (XLP), Industrials (XLI) and Transports (XTN). That is a healthy chunk of the market leading while Technology and Discretionary reversed.
Now, the question is “what comes next?”. Is this a healthy pullback with a rotation component or a crack in the bull market? Buyable dip or a larger correction still ahead? Wednesday’s inflation report will go a long way toward answering this. A hot CPI landing on top of Friday’s hot jobs number would pour more fuel on the yield fire, and that’s the thread to watch.
Technically speaking, there was no damage done to the bull trend, which is 100% intact. Yes, SPY broke through 2 levels of short term support (R1, and the 20-DMA), and the key level to watch for is $717 (M-trend) to the downside. A reclaim of $750 is what puts all time highs in the focus again. A break below $717 (unlikely) will prove far more problematic, since the 200-DMA at $680 would come next. If a full 200-DMA retracement were to happen, it would mark another -10% decline in the span of just 3 months.
Here’s the catch: since 1945, the S&P 500 has experienced 33 corrections of 10% or more on a closing basis, the most recent being this year’s slide from the January 27 peak of 6,980.75 to the late-March low. A -10% decline is not a rare event, but it’s not one that tends to happen on a back-to-back basis either. Deep declines (-20% or more) tend to be years apart, while -5% -10% dips happen with a yearly frequency.
As such, given the 2025 washout (-20%) and this year’s -10% decline, the next pullback should be shallow (and rather normal).
Carson Research notes a 2 month return of 19% or more tends to resolve positively 100% of the time over every time horizon from 1 to 12 months. Average returns over the year are 41%. Given the very small sample size, this should be taken with a grain of salt, but it’s a starting point for historical precedent.
Hedgeye noted a new record for SPX put volume on Friday, with every other previous record instance noted on the chart. Returns going forward tend to be positive especially at the 3 and 12 month marks (see table below the chart for the returns distribution, as calculated by @oddstats on X).
@WayneWhaley1136 computed the historical performance of the S&P 500 following a -2% down day occuring on the back of a trailing double digit gains over the prior 13wks (1 quarter).
The forward performance in those 34 cases was, on average, of the Bullish friendly variety. The vast majority of outcomes 6-months and 1-year ahead were positive (+11% and +17% returns on average).
Our general observation is two fold. On one hand, notable anxiety clearly exists, with high levels of digital ink spilled over the weekend and various analysts poring over the historical stats and attempting to glimpse into the future.
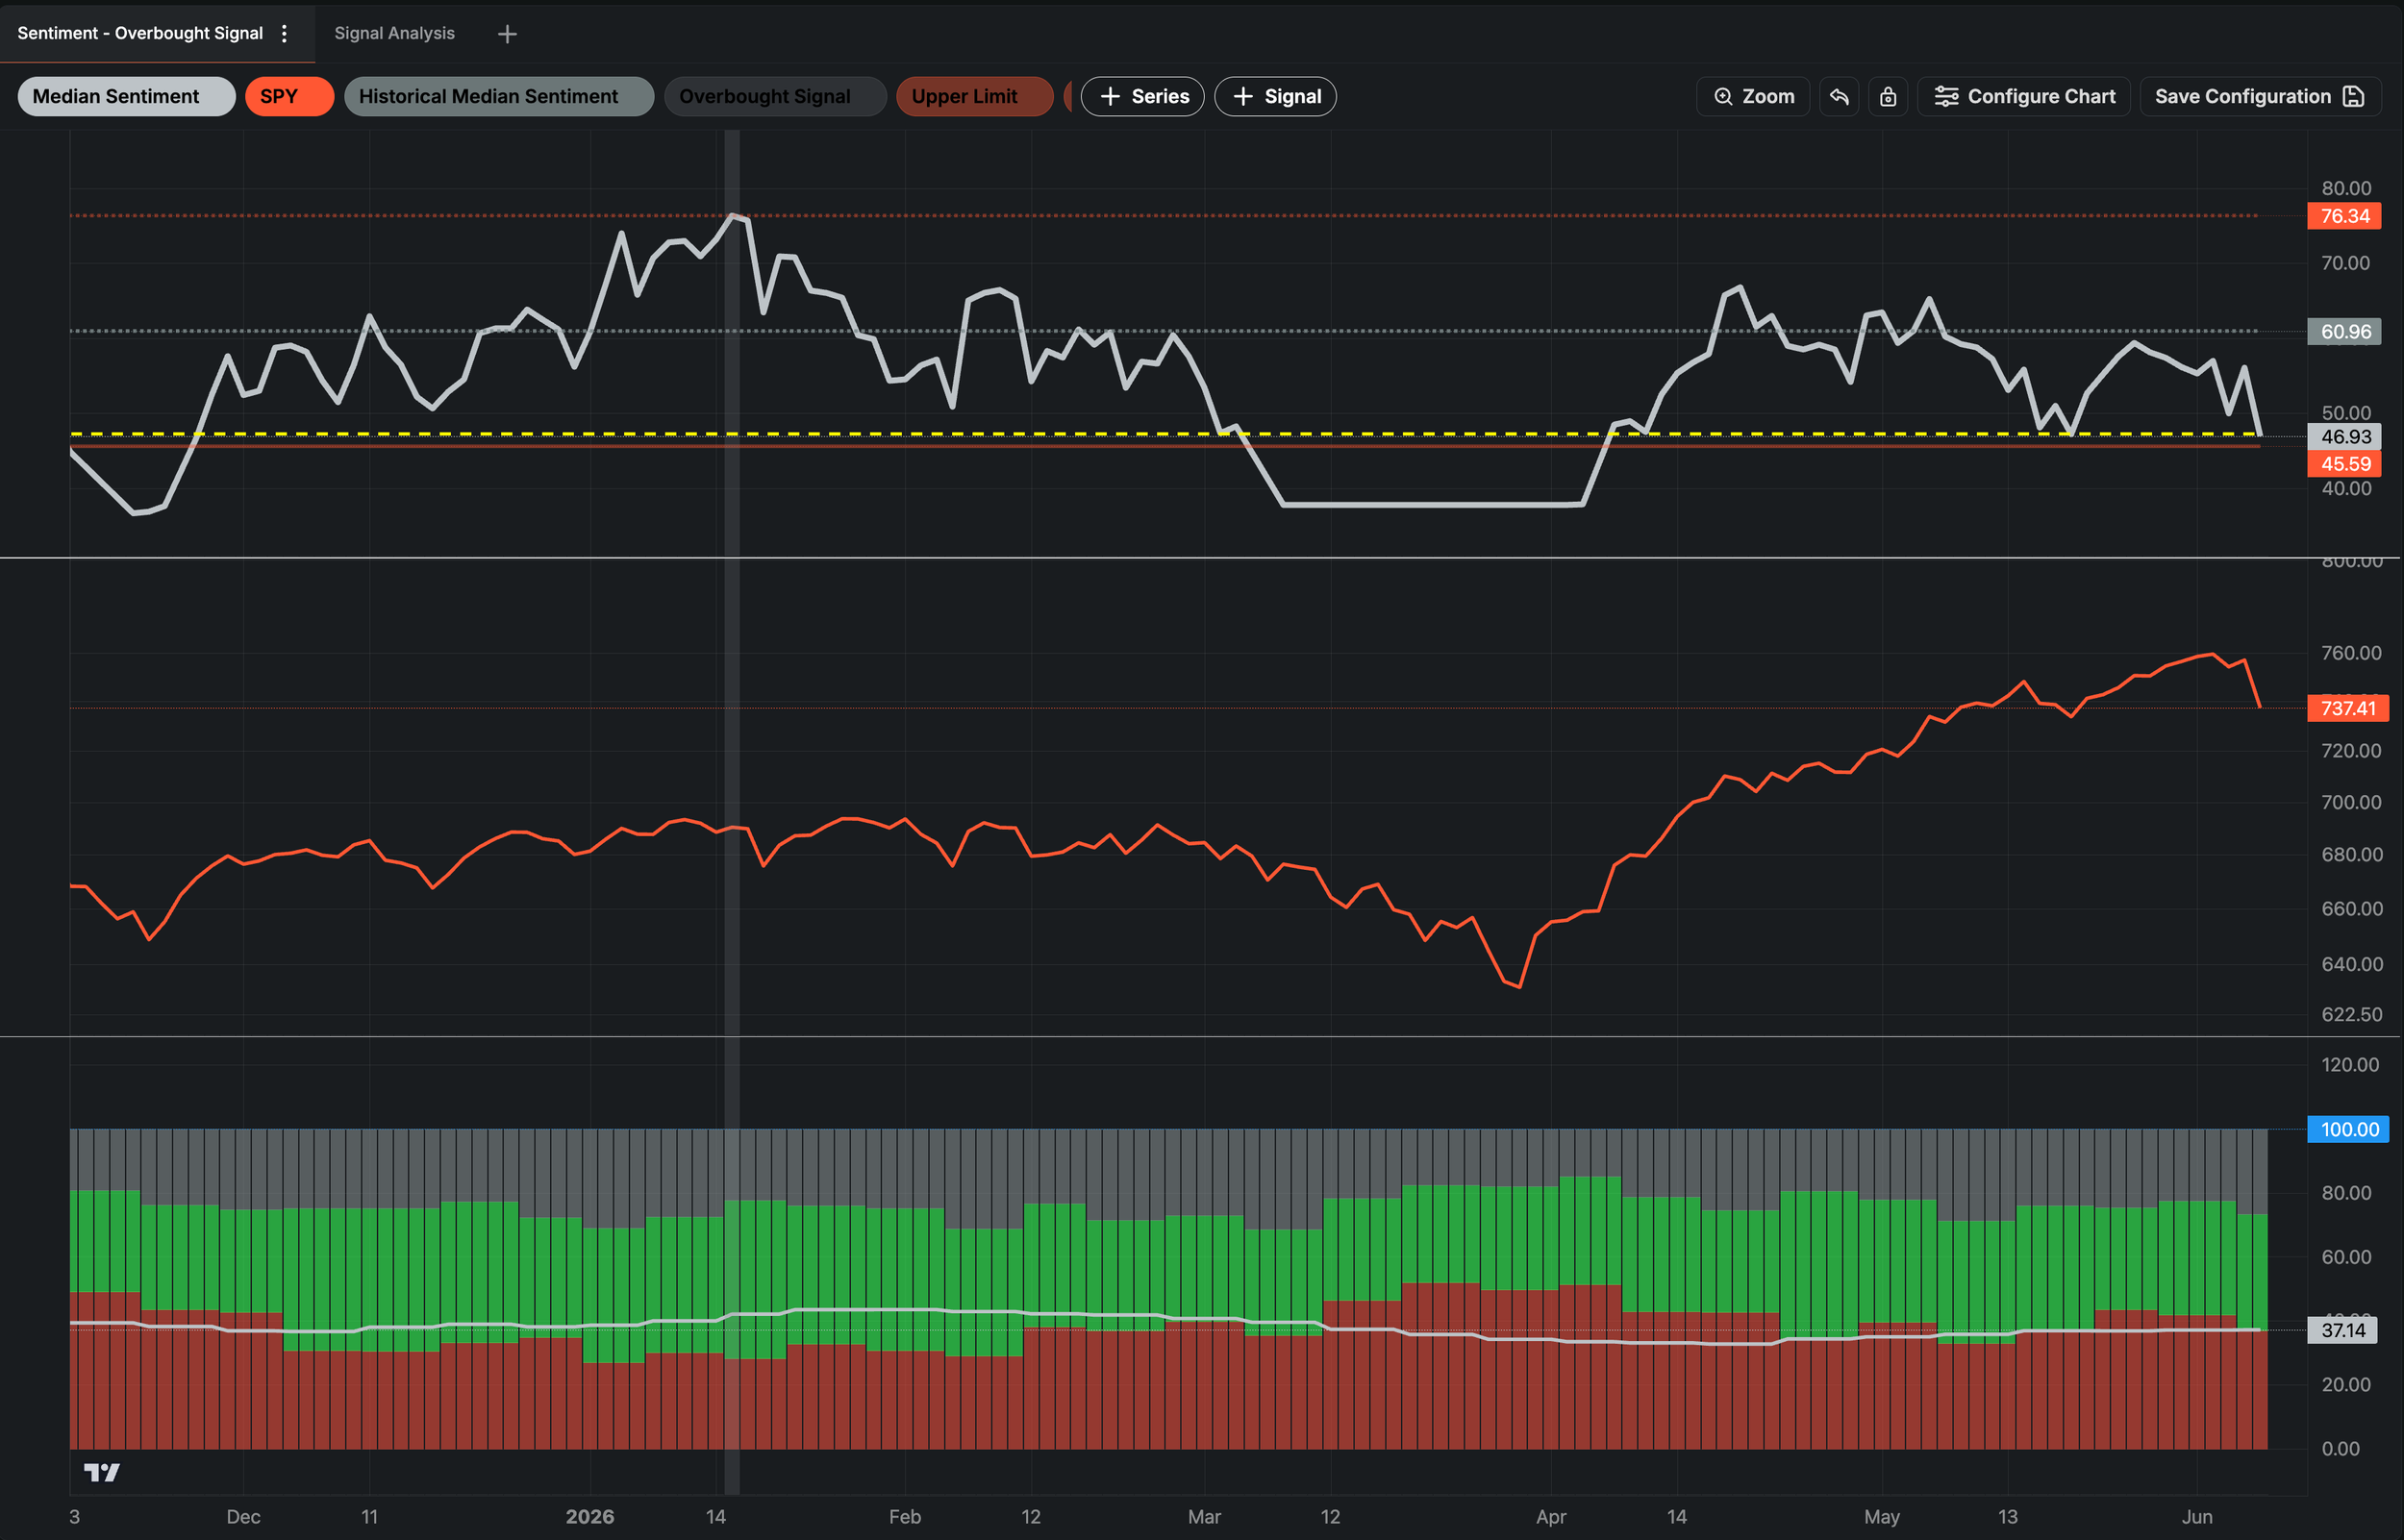
Investor sentiment is hovering near “Fear” levels at the moment, with our proprietary metric (upper panel) now reading 47 / 100.
Our second core observation is that the market was sufficiently hedged in the short term leading up to Friday’s decline.
Bob Farrell’s Rule #9 warns that “when experts and forecasts agree, something else is going to happen”. At present, investors are broadly positioned for a market top, watching the same overbought indicators, narrow breadth measures, and the weak summer seasonality.
This collective mentality reduces the probability of a dramatic crash. A routine, mean-reverting pullback + consolidation is the more likely outcome in this instance. Short term downside still eclipses risk in the medium term (yellow bars longer than orange bars on the lower histogram).
Also, note the commensurate increase in long term positioning, with upside increasing on the drawdown. This is the tell that the longer term picture is intact.

Our Trading Strategy (Sigma Portfolio)
In conclusion, we would say the current pullback is healthy. Though the decline across our portfolios and models was quite painful (-4.8% for Millennium Alpha, -8% for Vision and -12% for Momentum), volatility is the price we pay for performance. These kinds of sharp losses over a short period are simply features of momentum based models. It’s the toll the market charges for the gains it hands out the rest of the time.
For our fresh and un-allocated client portfolios, the decline is a real opportunity to add exposure. We will maintain our core positioning for the time being and take inspiration from tomorrow’s rebalancing of the Enterprise strategy.
The inflation report on Wednesday is the core data release for the week and will likely dictate the future path of the market from here. A 50-DMA retest for SPY may well be in the books. Holding the 50-DMA by Friday tells us if we’re getting a deeper correction or a healthy pause. Our money is on the latter due to the positive historical precedent, persistent Buying Regime, and relatively cautious investor sentiment and positioning.
Also, let’s not dismiss the pricing of the largest IPO in history - Space X. At a $1.75T valuation and shares 2x oversubscribed, the IPO has surely drained liquidity from other parts of the market, as investors make room for this new position in their portfolios.
This should be a breather, not a peak.
Disclosures / Disclaimers: This is not a solicitation to buy, sell, or otherwise transact any stock or its derivatives. Nor should it be construed as an endorsement of any particular investment or opinion of the stock’s current or future price. To be clear, I do not encourage or recommend for anyone to follow my lead on this or any other stocks, since I may enter, exit, or reverse a position at any time without notice, regardless of the facts or perceived implications of this blog post. I currently do not own or plan to own any position, long or short, in the securities mentioned.
I am not a financial advisor licensed in the United States. Nor am I providing any recommendations, price targets, or opinions about valuation regarding the companies discussed herein. Any disclosures regarding my holdings are true as of the time this article is written, but subject to change without notice. I frequently trade my positions, often on an intraday basis. Thus, it is possible that I might be buying and/or selling the securities mentioned herein and/or its derivative at any time, regardless of (and possibly contrary to) the content of this blog post.
I undertake no responsibility to update my disclosures and they may therefore be inaccurate thereafter. Likewise, any opinions are as of the date of publication, and are subject to change without notice and may not be updated. I believe that the sources of information I use are accurate but there can be no assurance that they are. All investments carry the risk of loss and the securities mentioned herein may entail a high level of risk. Investors considering an investment should perform their own research and consult with a qualified investment professional.
I wrote this blog post myself, and it expresses my own opinions. I do not have a business relationship with any company whose stock is mentioned in this blog post. The information in this blog post is for informational purposes only and should not be regarded as investment advice or as a recommendation regarding any particular security or course of action.
The primary purpose of this blog post is to share industry expertise and research and receive feedback (confirmation / refutation) regarding my investment theses.