/ November 10 / Weekly Preview
-
Monday:
N/A
---
Tuesday:
ADP Employment Change Weekly
---
Wednesday:
Various Fed Speakers
---
Thursday:
N/A
---
Friday:
N/A
-
Monday:
Barrick Mining Corporation
CoreWeave, Inc.
Occidental Petroleum Corporation
Rocket Lab Corporation
---
Tuesday:Sea Limited
---
Wednesday:
Cisco Systems, Inc.
Nu Holdings Ltd.
---
Thursday:
Walt Disney Company (The)
Applied Materials, Inc.
Mitsubishi UFJ Financial Group Inc
---
Friday:
Sony Group Corporation
Ubiquiti Inc.
The Stage Is Set For A Rebound Rally
Got a question about the markets, your investments, or a topic you’d like us to discuss in an upcoming article? We read every message and may feature your question in our daily write-ups!
Email: andrei@signal-sigma.com
Follow & DM on X: @signal_sigma
Over the past week, the primary driver for the markets have been key technology and AI-related earnings reports. Among other drivers, the Fed’s recent policy shift and the ongoing government shutdown have also impacted risk assets, but it was primarily corporate results which kept investors engaged.
The macroeconomic calendar was severely limited due to the unavailability of data, and that continues to be the case this week as well (though recent developments over the weekend point to a resolution).
Overall, key earnings reports from AI-focused and large-cap technology companies showed ongoing revenue and profit expansion, though they missed the high expectations set by overly optimistic forecasts (and implicit lofty prices).
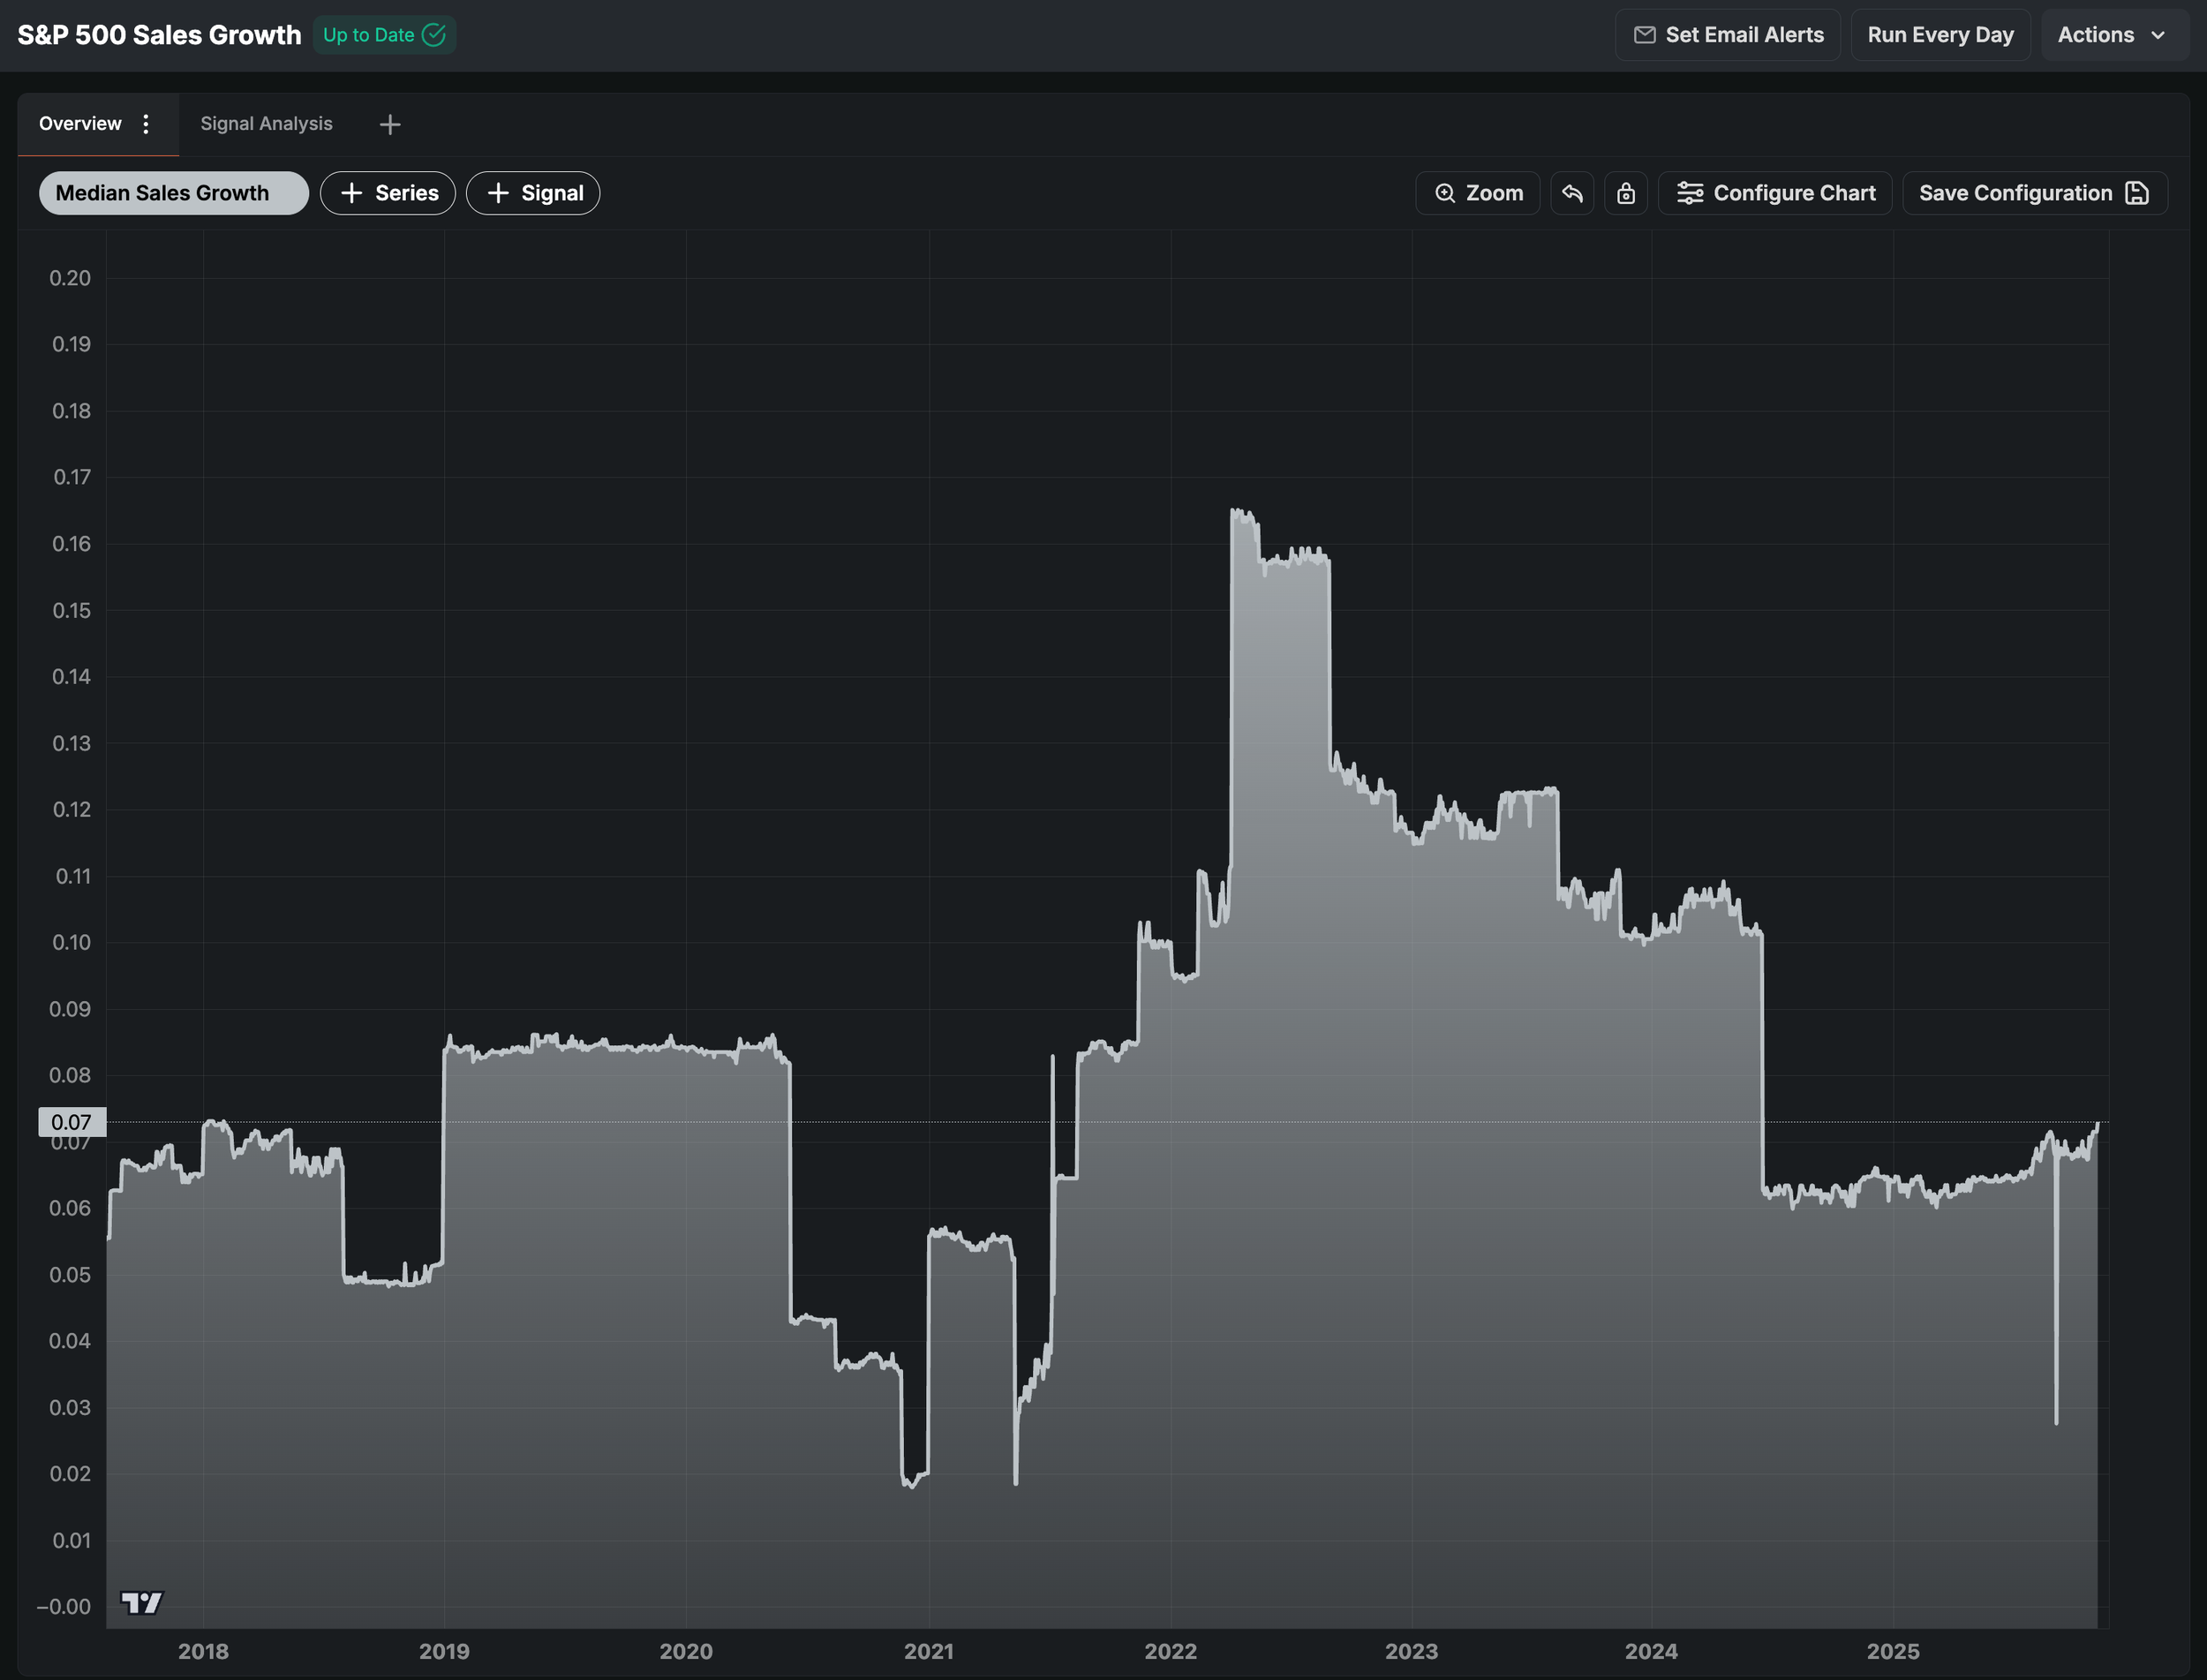
According to FactSet, the blended year-over-year earnings growth rate for the S&P 500 in Q3 stands at 10.7%, up from 7.9% at the start of earnings season. Revenue growth has reached 4.9%, exceeding both the five-year and ten-year averages. If we equal-weight the EPS Growth rate (as we did in this Market Study) we get +6%, a clear stabilization trend post the 2022 peak.
Equal weighted sales growth is now accelerating, pointing to a +7% expansion for index constituents.
While encouraging from a fundamental breadth perspective, both of these metrics are being fully priced in relative to current valuations. Increasingly, growth is being concentrated in a handful of names and Sectors. For instance, Tech (XLK) is at the forefront with an earnings growth rate of 26.5%. Consumer Discretionary (XLY) has returned to positive growth, whereas Communication Services (XLC) underperformed, hindered by challenges from companies like Meta, which, despite exceeding revenue and earnings expectations, was affected by a one-time tax-related expense.
Many AI-focused companies exceeded expectations, yet the market responded cautiously due to higher capital expenditures and more conservative forward guidance. Investor reactions have been mixed, at best. Despite a high number of earnings beats, several positive reports resulted in negative price movements. This indicates that the market is factoring a lot of the future results and any reduced outlook concerning growth, profitability, and investment (especially AI infrastructure CAPEX) has the potential to tank the stock price (see META as an example).
Case in point: forward 12-month P/E for the S&P 500 is now approximately 22.9x, above the five-year average of 19.9x and the ten-year average of 18.6x. In effect, this raises the stakes for any negative surprises in guidance or execution. Going into 2026, Apollo notes the growth projection trends, which have become increasingly and almost solely anchored to Magnificent 7 performance.
Expectations are currently for negative growth from the bottom 493 index constituents.
As a summary thus far:
Earnings growth continues to be strong, but is becoming more reflected in current prices.
Market advances are primarily driven by a select group of large-cap technology and AI companies.
Valuations are high, while overall market participation remains muted.
Investors are focusing on forward guidance and capital allocation, particularly among firms linked to AI.
We expect returns on AI infrastructure spend to be increasingly scrutinized. Overall, the market’s technical structure remains bullish, but fragile beneath the surface. Market Breadth has declined, with an increasing number of stocks trading below key averages, including the 200-DMA (shown below). The number of top volume stocks trading above the 200-DMA is 632 / 1000, at the lower end of the range that characterizes bull market advances.
The number of stocks above their 50-day moving average has dropped even more sharply, down to just 47%, with participation narrowing in key sectors.
Technically speaking, the S&P 500 remains in a defined up-trend and continues to hold support at the 50-DMA and M-Trend level. Both the 50 and the 200-DMA are also rising, making intermediate-term momentum constructive, despite the underlying weakness in breadth.
With fewer stocks participating in the upside and a -3.5% drop from all-time highs, buyers entered the market on Friday, confirming support at $665. Relative strength has essentially reversed most of its previous overbought condition, but remains in a negative divergence overall. The medium-term stochastic indicator is neutral (49 / 100).
If stronger participation does not materialize soon, the rally is prone to a sharper correction. Downside stands at $620 (S1), while technical upside stands at $704 (R1).
Overall, a decent dip-buying condition is becoming set up. Note the shaded areas in the study below which correspond to the setup. We need to wait for a firm reversal of this condition before the BUY signal fires. Once triggered, a near-term advance is projected, with 74% positive results 1-Month after, and +1.23% median returns.
Key catalysts from this week remain several corporate earning reports and the re-opening of the U.S. government. Many federal economic data releases are queued up for publishing and might contain various positive or negative surprises (7 Initial Jobless Claims reports for instance).
Central‑bank commentary will also hold a key role, despite the Fed basically “flying blind”. From what limited data we do have available, we note a meaningful shift in the Treasury General Account.
The Government shutdown has drained over $700 billion from the market (unpaid salaries & contract work) which have resulted in a surge of the TGA (ticker DPTREAS-ECON). Once the Government gets reopened, that $700 billion increase in the Treasury General Account will flow back into the economy via back pay and re-opening of entire departments. These dollars will inevitably be put to work in the economy (or at least get deposited into bank accounts) and boost overall sales and liquidity just in time for Q4 holiday season.
Combined with newly opened share buyback programs form corporations, this flood of liquidity could provoke a scramble for risk-assets, helping fuel the rally back to all-time-highs. This is not to say that any of the fundamentals meaningfully improve, but if more dollars chase fewer assets, prices can only go one way (and that is up).
The highest beneficiaries of such a move are unprofitable tech stocks, which thrive on easing financial conditions, and which have corrected more than the market currently (see the Vision Strategy and associated portfolio picks like AAOI, TTWO, ENVX, PATH).
Our Trading Strategy
The main themes for this week suggest an opportunity forming for some sectors and factors which have pulled back. Specifically, it’s now critical more than ever to remain engaged with the rally, but selective with individual names.
We will perform a 2-part rebalance. The first part involves selling underperforming positions into strength. Then, we will use the resulting cash to do the acquisition part of the portfolio rebalance, whenever the BUY signal gets triggered.
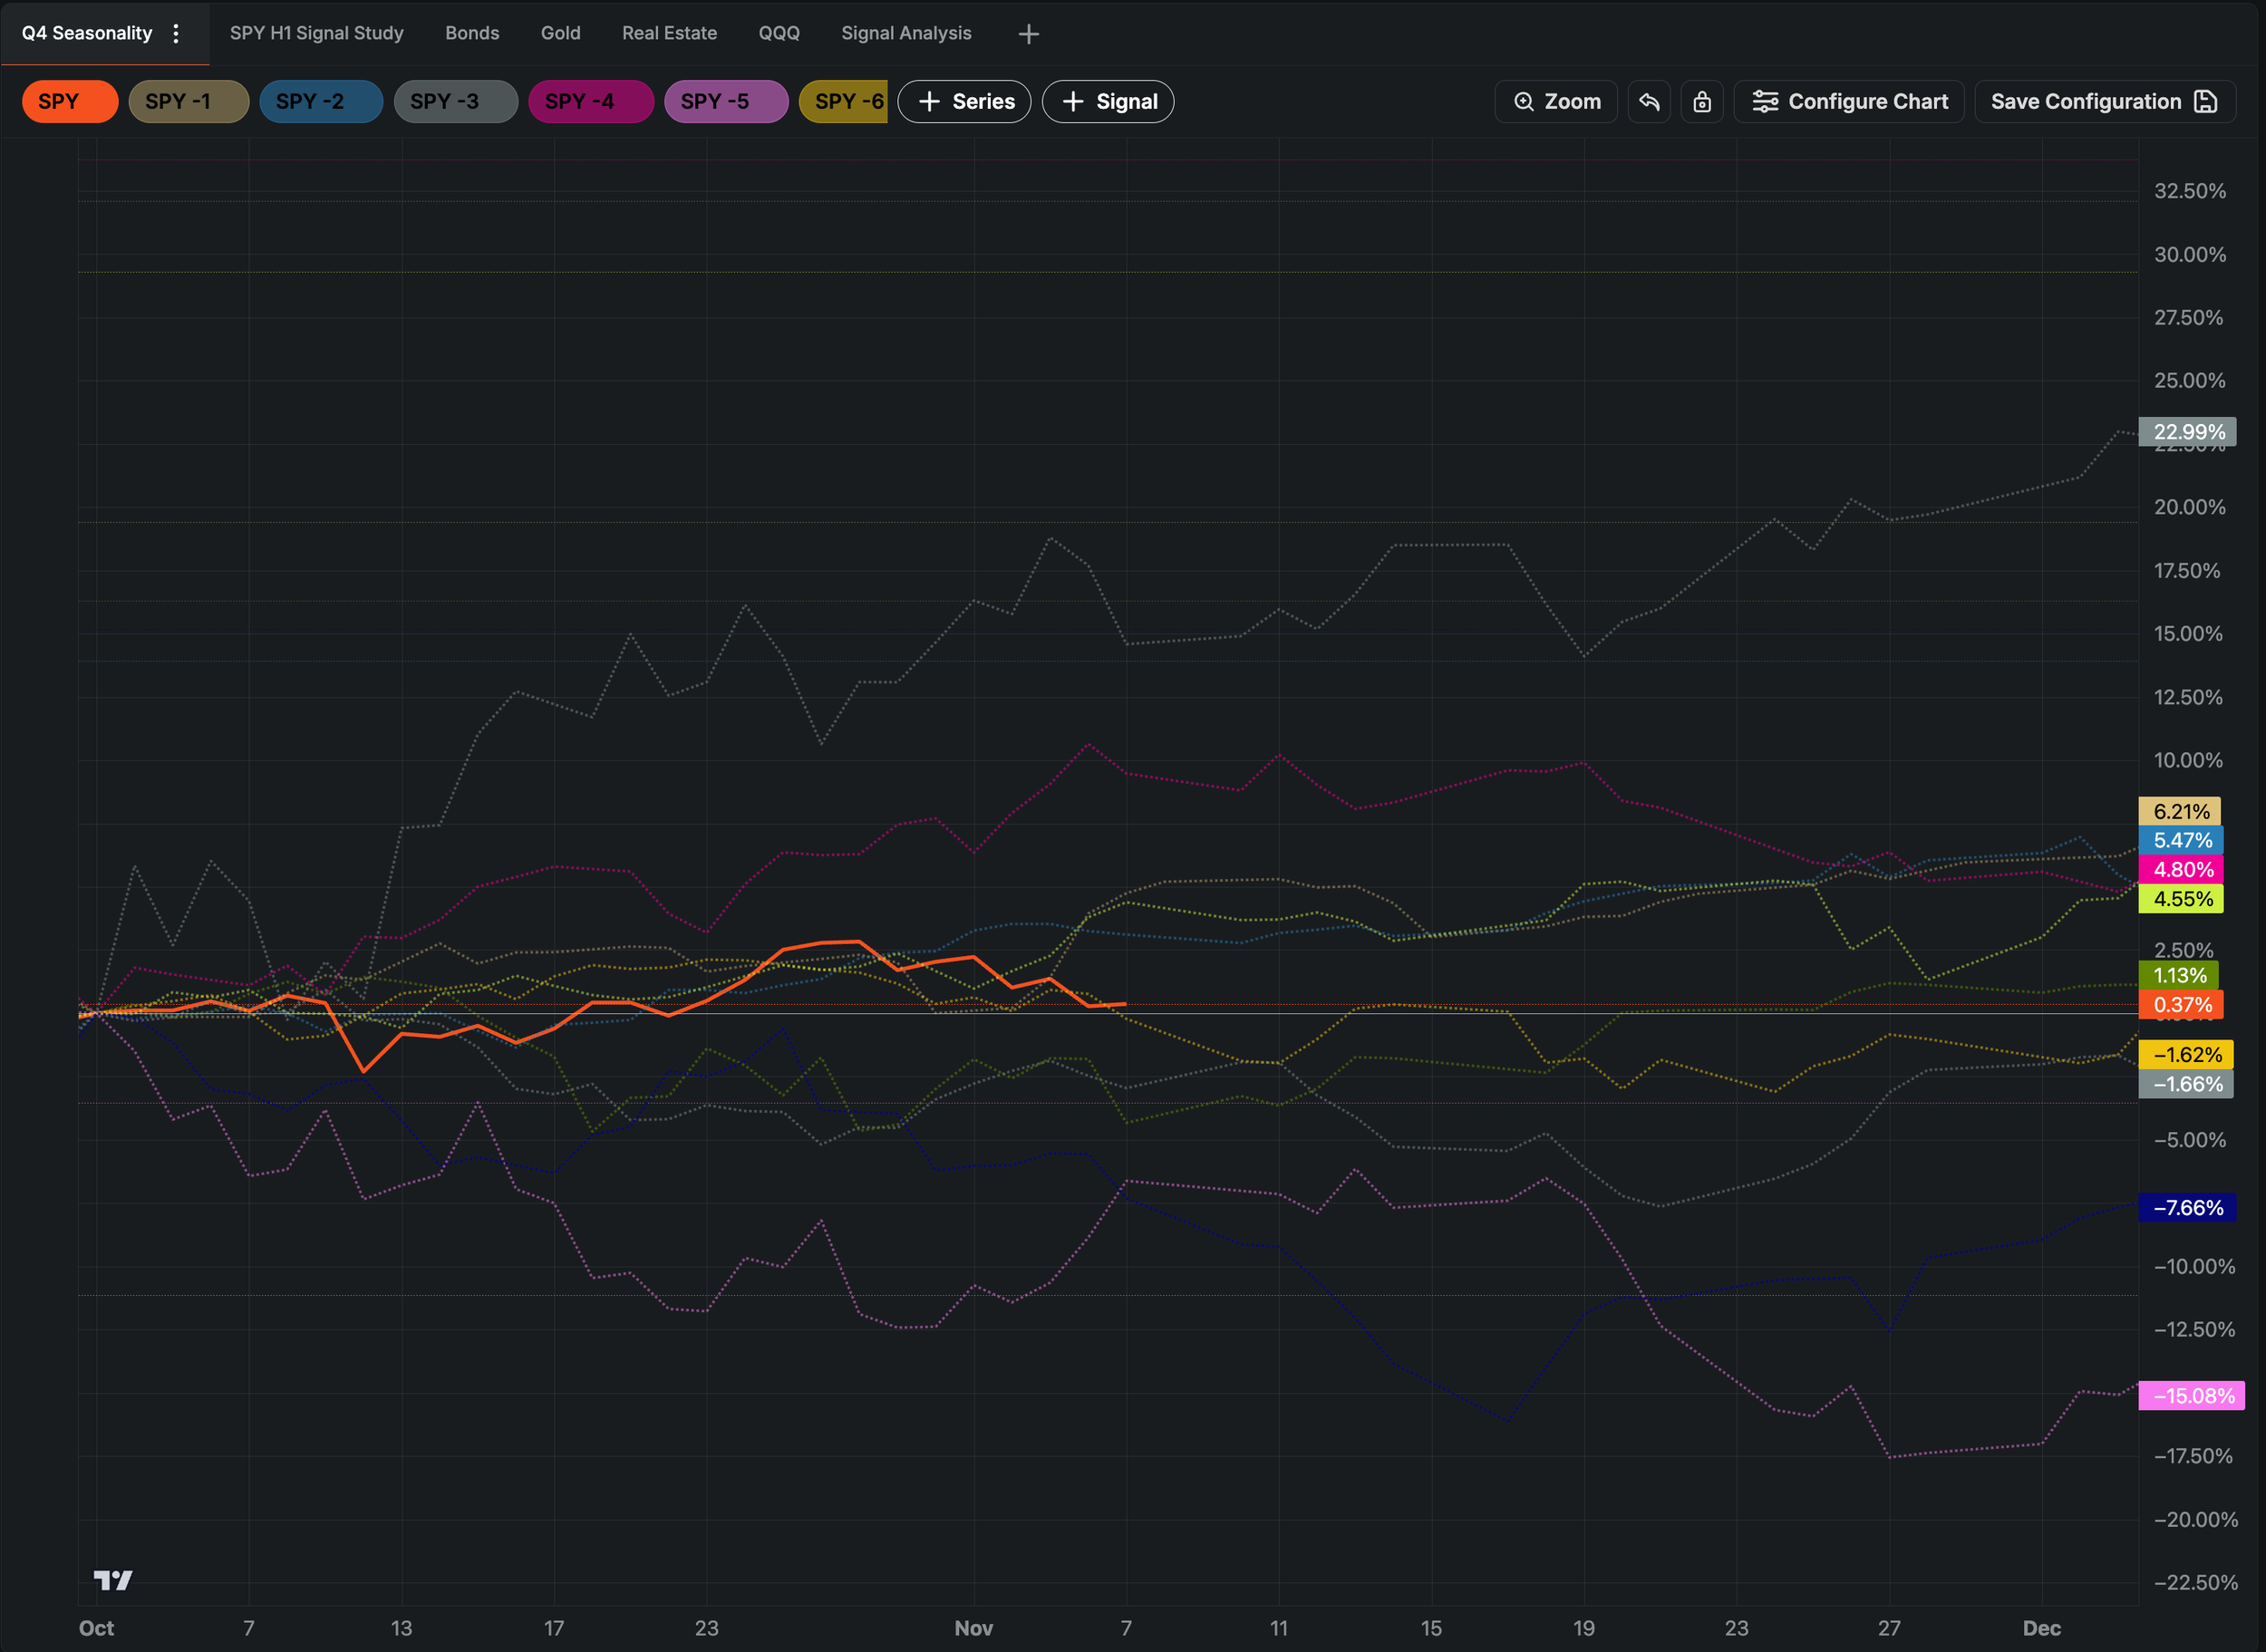
The NFIB index will serve as one of the few viable high‑frequency signals of business sentiment this week. We are also following Fed remarks by Cook and Jefferson as well as the remainder of earnings season. In theory, the absence of negative surprises should support risk assets, but the lack of fresh data increases vulnerability to unexpected developments. As shown below, Q4 has been very “middle of the road” in terms of performance so far.
With the Treasury General Account expected to drop sharply once the government reopens, upside could manifest quickly and substantially as the cash gets re-deployed in the economy. In this instance, the “buy-the-dip” setup relies mostly on liquidity and seasonal patterns rather than absolute fundamentals.
Once we enter 2026, we will reassess valuations and fundamentals, but until year end the stage is set for a (rebound) rally.
Signal Sigma Research & PRO members will be notified by Trade Alert of any live portfolio changes (if subscribed). If you’re not on this plan yet, you can get a free trial when you join our Society Forum. If you need any help with your trading strategy (or would like to implement one on your account), feel free to reach out!
Disclosures / Disclaimers: This is not a solicitation to buy, sell, or otherwise transact any stock or its derivatives. Nor should it be construed as an endorsement of any particular investment or opinion of the stock’s current or future price. To be clear, I do not encourage or recommend for anyone to follow my lead on this or any other stocks, since I may enter, exit, or reverse a position at any time without notice, regardless of the facts or perceived implications of this blog post. I currently do not own or plan to own any position, long or short, in the securities mentioned.
I am not a financial advisor licensed in the United States. Nor am I providing any recommendations, price targets, or opinions about valuation regarding the companies discussed herein. Any disclosures regarding my holdings are true as of the time this article is written, but subject to change without notice. I frequently trade my positions, often on an intraday basis. Thus, it is possible that I might be buying and/or selling the securities mentioned herein and/or its derivative at any time, regardless of (and possibly contrary to) the content of this blog post.
I undertake no responsibility to update my disclosures and they may therefore be inaccurate thereafter. Likewise, any opinions are as of the date of publication, and are subject to change without notice and may not be updated. I believe that the sources of information I use are accurate but there can be no assurance that they are. All investments carry the risk of loss and the securities mentioned herein may entail a high level of risk. Investors considering an investment should perform their own research and consult with a qualified investment professional.
I wrote this blog post myself, and it expresses my own opinions. I do not have a business relationship with any company whose stock is mentioned in this blog post. The information in this blog post is for informational purposes only and should not be regarded as investment advice or as a recommendation regarding any particular security or course of action.
The primary purpose of this blog post is to share industry expertise and research and receive feedback (confirmation / refutation) regarding my investment theses.