/ March 16 / Weekly Preview
-
Monday:
NY Empire State Manufacturing Index
---
Tuesday:
N/A
---
Wednesday:
Fed Interest Rate Decision (pause expected)
FOMC Economic Projections
Fed Press Conference
---
Thursday:
Initial Jobless Claims (211K exp.)
---
Friday:
N/A
-
Monday:
Hewlett Packard Enterprise Company
Vail Resorts, Inc.
---
Tuesday:
Oracle Corporation
BioNTech SE
---
Wednesday:
SilverBox Corp IV
UiPath, Inc.
---
Thursday:
Alibaba Group Holding Limited
Adobe Inc.
Dollar General Corporation
Ulta Beauty, Inc.
---
Friday:
RLX Technology Inc.
“Houston, we might have a problem”
Got a question about the markets, your investments, or a topic you’d like us to discuss in an upcoming article? We read every message and may feature your question in our daily write-ups!
Email: andrei@signal-sigma.com
Follow & DM on X: @signal_sigma
The S&P 500 extended its losses to a third consecutive week, the first such run in about a year. An overlap of geopolitical shock, stress in private credit markets and deteriorating economic data are dimming future prospects for investors who were not eager to buy the dip.
Monday’s session was especially brutal, with oil surging +30% to $119 and asian markets bleeding -7% as Tehran throttled the Strait of Hormuz. WTI pulled back sharply the same day, as President Trump signaled the conflict was nearing its end, triggering the S&P 500’s best single-session gain in a month. But that was not the “all clear” signal that investors were looking for. Just a couple of days later, Iran’s newly appointed Supreme Leader, Mojtaba Khamenei, said the Strait must stay closed as a “tool to pressure the enemy,” prompting renewed selling of both stocks and bonds.
The problem that we see is that an oil shock is simply a catalyst within an ongoing economic slowdown and an overvalued market. February payroll numbers were negative, with the US economy shedding 92K jobs, far below estimations of a 55K gain. Then, the 2’nd revision of US GDP for Q4 2025 came in at just +0.7%, just half the expected gain of +1.4%. Now, it’s the Fed’s turn to reach a decision this week, which will likely be a “pause” on rates and a “wait and see” approach as guidance. Bulls will not be excited to hear this.
More troubling (and perhaps below the radar of most retail investors) is the widening issue in the private credit markets. Major asset managers have limited investor withdrawals from large private credit funds: Morgan Stanley and Cliffwater imposed caps on redemptions from their multi-billion-dollar vehicles. BlackRock’s $26 billion HPS Corporate Lending Fund received redemption requests equal to 9.3% of assets but honored only 5%, effectively locking up the remaining requests. JPMorgan said it would curb lending to private credit firms after writing down several loans, indicating stress is moving from shadow banking into traditional bank balance sheets. Shares of Blue Owl, Blackstone, and Apollo each fell roughly 2–3% during the week as the private credit sector repriced.
The market is simultaneously repricing on a series of fronts: geopolitics -> inflation -> credit -> impact on earnings growth.
As it stands right now, there’s nothing to indicate a quick solution or a “v-shaped” rebound as we’ve been accustomed to recently. Consumer sentiment declined to 55.5 in March with the survey director noting that early-month optimism was “completely erased” once the Iran conflict escalated.
Higher gasoline prices had the most immediate effect on consumers, although the broader pass-through to other prices remains uncertain. A wide range of respondents across income groups, age brackets, and political affiliations reported weaker expectations for their personal finances, which fell 7.5% nationwide. Year-ahead inflation expectations held at 3.4%, ending six months of declines, while long-term expectations edged down to 3.2% from 3.3%.
U Michigan Consumer Sentiment Index
This is now turning into a “show me” market, with the Strait of Hormuz becoming the focal point. Until ships start navigating as normal, the path of least resistance for equity markets is lower.
Over the past 2 weeks, the spike in oil and oil volatility shocked investors, as a whole series of data points need to be repriced. By all measures, the current supply disruption is the single largest shock in the history of the modern oil era, far eclipsing the Russia - Ukraine war or previous clashes in the Gulf.
Rapidan Energy Group reports that the Iran War has disrupted about 20% of global oil flows through the Strait of Hormuz — more than double the ~10% disruption recorded during the 1956 Suez Crisis. For perspective, the 1973 Arab oil embargo, which helped trigger a severe 20th-century recession, cut global supply by roughly 7%. The current disruption is therefore nearly three times larger than the 1973 shock and is concentrated at one of the world’s most critical shipping chokepoints.
“The Strait of Hormuz remains the single most consequential energy chokepoint on earth. What we’re witnessing is not just a price spike — it’s a structural test of the global energy architecture.”
— Energy Analyst, Rapidan Energy Group
With oil prices spiking from $73/bbl to $119.5 on March 09, crude volatility (OVX Index) also increased dramatically. The price of oil has pulled back sharply since, especially after the International Energy Agency announced a historic 400 million barrel reserve release.
But crude volatility barely budged. This is a key disconnect at the moment, because when the volatility index of a commodity remains elevated, it indicates that the market has not resolved uncertainties. In other words, we may only be seeing a pause or consolidation in oil prices at the moment, and not a definite downturn.
Oil volatility becomes a key indicator to watch, as it reverberates across equity volatility and credit spreads. Higher spreads and vol equals lower asset prices.
There are 2 main drivers of prices in the coming week. The first and most important catalyst is the security situation in the Strait of Hormuz. To put it bluntly, there is no policy tool or measure available that will stabilize oil prices unless and until Hormuz shipping is physically secured.
“Escorting every tanker would require many warships and close allied coordination, but the US Navy has limited vessels available due to ongoing operations. For now, the broader US strategy appears focused on degrading Iran’s asymmetric capabilities threatening shipping — coastal anti-ship missiles, naval mines, drones, and IRGC speedboat swarm attacks — as well as destroying the factories producing these systems. Once these threats are sufficiently reduced, naval escorts and government-backed insurance could restore confidence for tankers to transit the Strait.”
— Natasha Kaneva, Head of Global Commodities Strategy, J.P. Morgan
We can expect rumours and verbal intervention to drive 10-15% daily moves in prices, but verbal intervention does not move tankers. Iran’s capacity to strike vessels in the straight needs to be degraded to the point insurers will provide coverage. As such, the supply shock is very real and not sentiment driven.
The chart below shows an estimated total supply shut-in, courtesy of JP Morgan. Every day that the strait remains closed is adding to the total disruption, and the IEA’s 400M barrel release is only buying the market 20 days. As such, it is only a short term solution. At the current rate, the world’s petroleum reserve buffer is being consumed VERY fast.
The most important question now becomes — how long will the war last? We already know what lies on the other side of the equation (an inflationary recession).
Oil prices matter far beyond energy markets. Especially when inflation is a hot political topic. Polls aggregated from NBC, Fox, Marist show Trump has the lowest approval on inflation out of the major categories tracked. Each dollar increase in gasoline prices functions like a direct tax on the working-class voters who secured the 2024 victory. The push to lower oil prices is therefore more than an economic concern; it’s central to the administration’s ability to advance its legislative priorities and to its standing heading into the 2026 midterms.
Higher oil prices raise inflation risk, and this price volatility becomes politically dangerous—especially if it contributes to an economic slowdown or recession.
Historically, armed conflicts are typically transitory events and the market ends up higher in the majority of cases (Russia - Ukraine war being the most recent example). A study by Carson research indicated that the S&P 500 was higher 65% of the time one year after major geopolitical events since World War II.
However, the key variable remains the price of oil. It’s one thing to have a manageable geopolitical event and another to have a sudden supply shock that transmits to the real economy. The historical events that we’ve focused on all led to at least partial slowdowns in the US (and the world’s) economy.
Data show the S&P 500 fell -13% in the three weeks after Iraq invaded Kuwait in 1990. In October 1973, when Arab OPEC members halted oil exports to the U.S., the index dropped -17% over the subsequent two months, then tumbled another -44% across the next 11.5 months as the “Nifty Fifty” bubble burst. The link is not war itself but oil.
In this context, the current disruption is orders of magnitude larger than any prior shock.
The key—and sole—question for any investor is whether the shock is brief enough to be absorbed, or whether its duration will transform it into a full-scale macro transmission event. Consider the following points:
Consumer tax: Every sustained $10 rise in oil prices acts like a $100–150 billion annual tax on the U.S. economy. Gas jumped from $3.00/gal pre-strike to $3.54/gal by March 10 (≈21% in two weeks), so consumers are already bearing the first transmission. If oil holds above $100/barrel, the household-equivalent “gas tax” would approach $600–800/year. That burden comes as credit-card delinquencies are elevated and personal savings are strained, leaving households little cushion;
The Fed’s dilemma: Weak growth combined with high inflation is a worst-case scenario for the Federal Reserve. February payrolls showed net job losses, and the labor market was already weakening before the shock. Markets had priced rate cuts in Q2 but now expect relief no earlier than late 2026. The Fed faces the 2022 low-growth-plus-inflation problem with less policy room to maneuver;
Aviation and supply-chain contagion: Jet fuel prices are rising faster than crude, worsening operating-cost pressure for airlines (fuel can be ~25% of costs). Airline stocks plunged (United and Delta down >5% on March 5) while energy equities (XOP ETF) jumped ~30% YTD to multi-year highs—highlighting the zero-sum nature of an oil shock. Deutsche Bank warned weaker carriers could face operational stoppages without relief. Rerouting tankers to avoid the Strait of Hormuz adds ~3,000 miles and weeks to transit for Asia-bound cargo, triggering cascading supply-chain delays that will take months to normalize even after normal routes resume;
A sustained oil-price shock is a net negative for the S&P 500: Energy accounts for only ~3% of market cap so higher oil yields little index-level gains while causing earnings downgrades for ~85% of constituents, with Materials and Industrials among the primary casualties;
The Fed takes center stage as the FOMC convenes on March 17-18. Against a backdrop of a weakening labor market, $100 oil and Core PCE running at 3.0%, they’re facing a textbook definition of a policy trap.
The rate decision itself is a foregone conclusion, as traders are pricing in a 90%+ probability of a “hold”. The real trade is the dot plot and the Summary of Economic Projections. As of the latest release, a single 25bps cut was forecasted for 2026. If the dots switch to zero cuts, rate expectations might violently reprice (a negative for risk assets). If they switch to 2 cuts, both bonds and stocks will catch a bid.
There were already 2 dissenters in January (Waller and Miran) who preferred a cut, so there is a degree of internal pressure building.
Powell’s press conference carries added weight as one of his final appearances before his term expires May 23, with hawkish-leaning Kevin Warsh the expected successor.
Wednesday morning’s PPI lands just hours before the FOMC decision, creating a rare same-day inflation-plus-policy collision. Producer prices will reveal whether upstream pressures — oil, tariffs, and supply-chain costs — are building in the pipeline before they reach consumer prices.
A hot PPI followed by a hawkish dot plot would be the worst-case scenario for risk assets: it would reinforce expectations of tighter policy under a Warsh-influenced Fed, push yields higher, and increase recession risk as tighter financial conditions compress spending and investment. Conversely, a benign PPI could give Powell room to signal gradualism, limit rate-path repricing, and temper market volatility ahead of the leadership transition.
Now we’ll turn to our quantitative and technical analysis for the market, given this lengthy exposition. We’ve put together a series of signals (old and new) in the same market study titled Losing Momentum.
There are several components to the study, that are particularly relevant today:
US Dollar (UUP) Absolute Z-Score 2Y — Yellow, upper graph
90-Day S&P 500 stocks median SPY correlation — silver, lower graph
Topping pattern breadth selling regime — grey shaded bars
Weak returns pattern for SPY (negative 1M and 3M returns, while positive 6M and positive 2Y trend) — orange vertical bars
This study is relevant because it visualizes 4 components which have been prescient indicators of near and medium term bearish market performance in the past. None is perfect by itself, but you can see how the alignment of these indicators suddenly becomes problematic.
A US dollar spike (Z-Score turns up) is not normally associated with equity market performance, since a stronger dollar makes US exports less competitive.
Rising (and especially sudden spikes) in SPY cross correlation is indicative of market stress, since all stocks trade together in “indiscriminate” market conditions — panic, that is.
Weak return periods for SPY sometimes are associated with consolidation periods or minor drawdowns, unless other factors are also present.
Finally, lots of stocks trading in topping pattern conditions suggest a major repricing may be underway, especially when 2 / 3 prior indicators also trigger. (as of Friday’s close, this has not yet actually triggered, but a negative session is all it takes).
All of this is highly concerning, since the risk of repricing is beginning to be high. Furthermore, we are not trading in a Buying Regime. Our core asset allocation strategy (Enterprise) is defensive on equity risk allocations. There’s been an entire cluster of short and medium term sell signals recorded in January - mid February.
All of this is to say the portfolio management dynamic has changed from “dip buying” to “rally selling” — especially if the motivation for a rally is technical (bounce from oversold) or speculative in nature. The kind of rally that we’d like to see should be based on a clear resolution to the Hormuz situation.
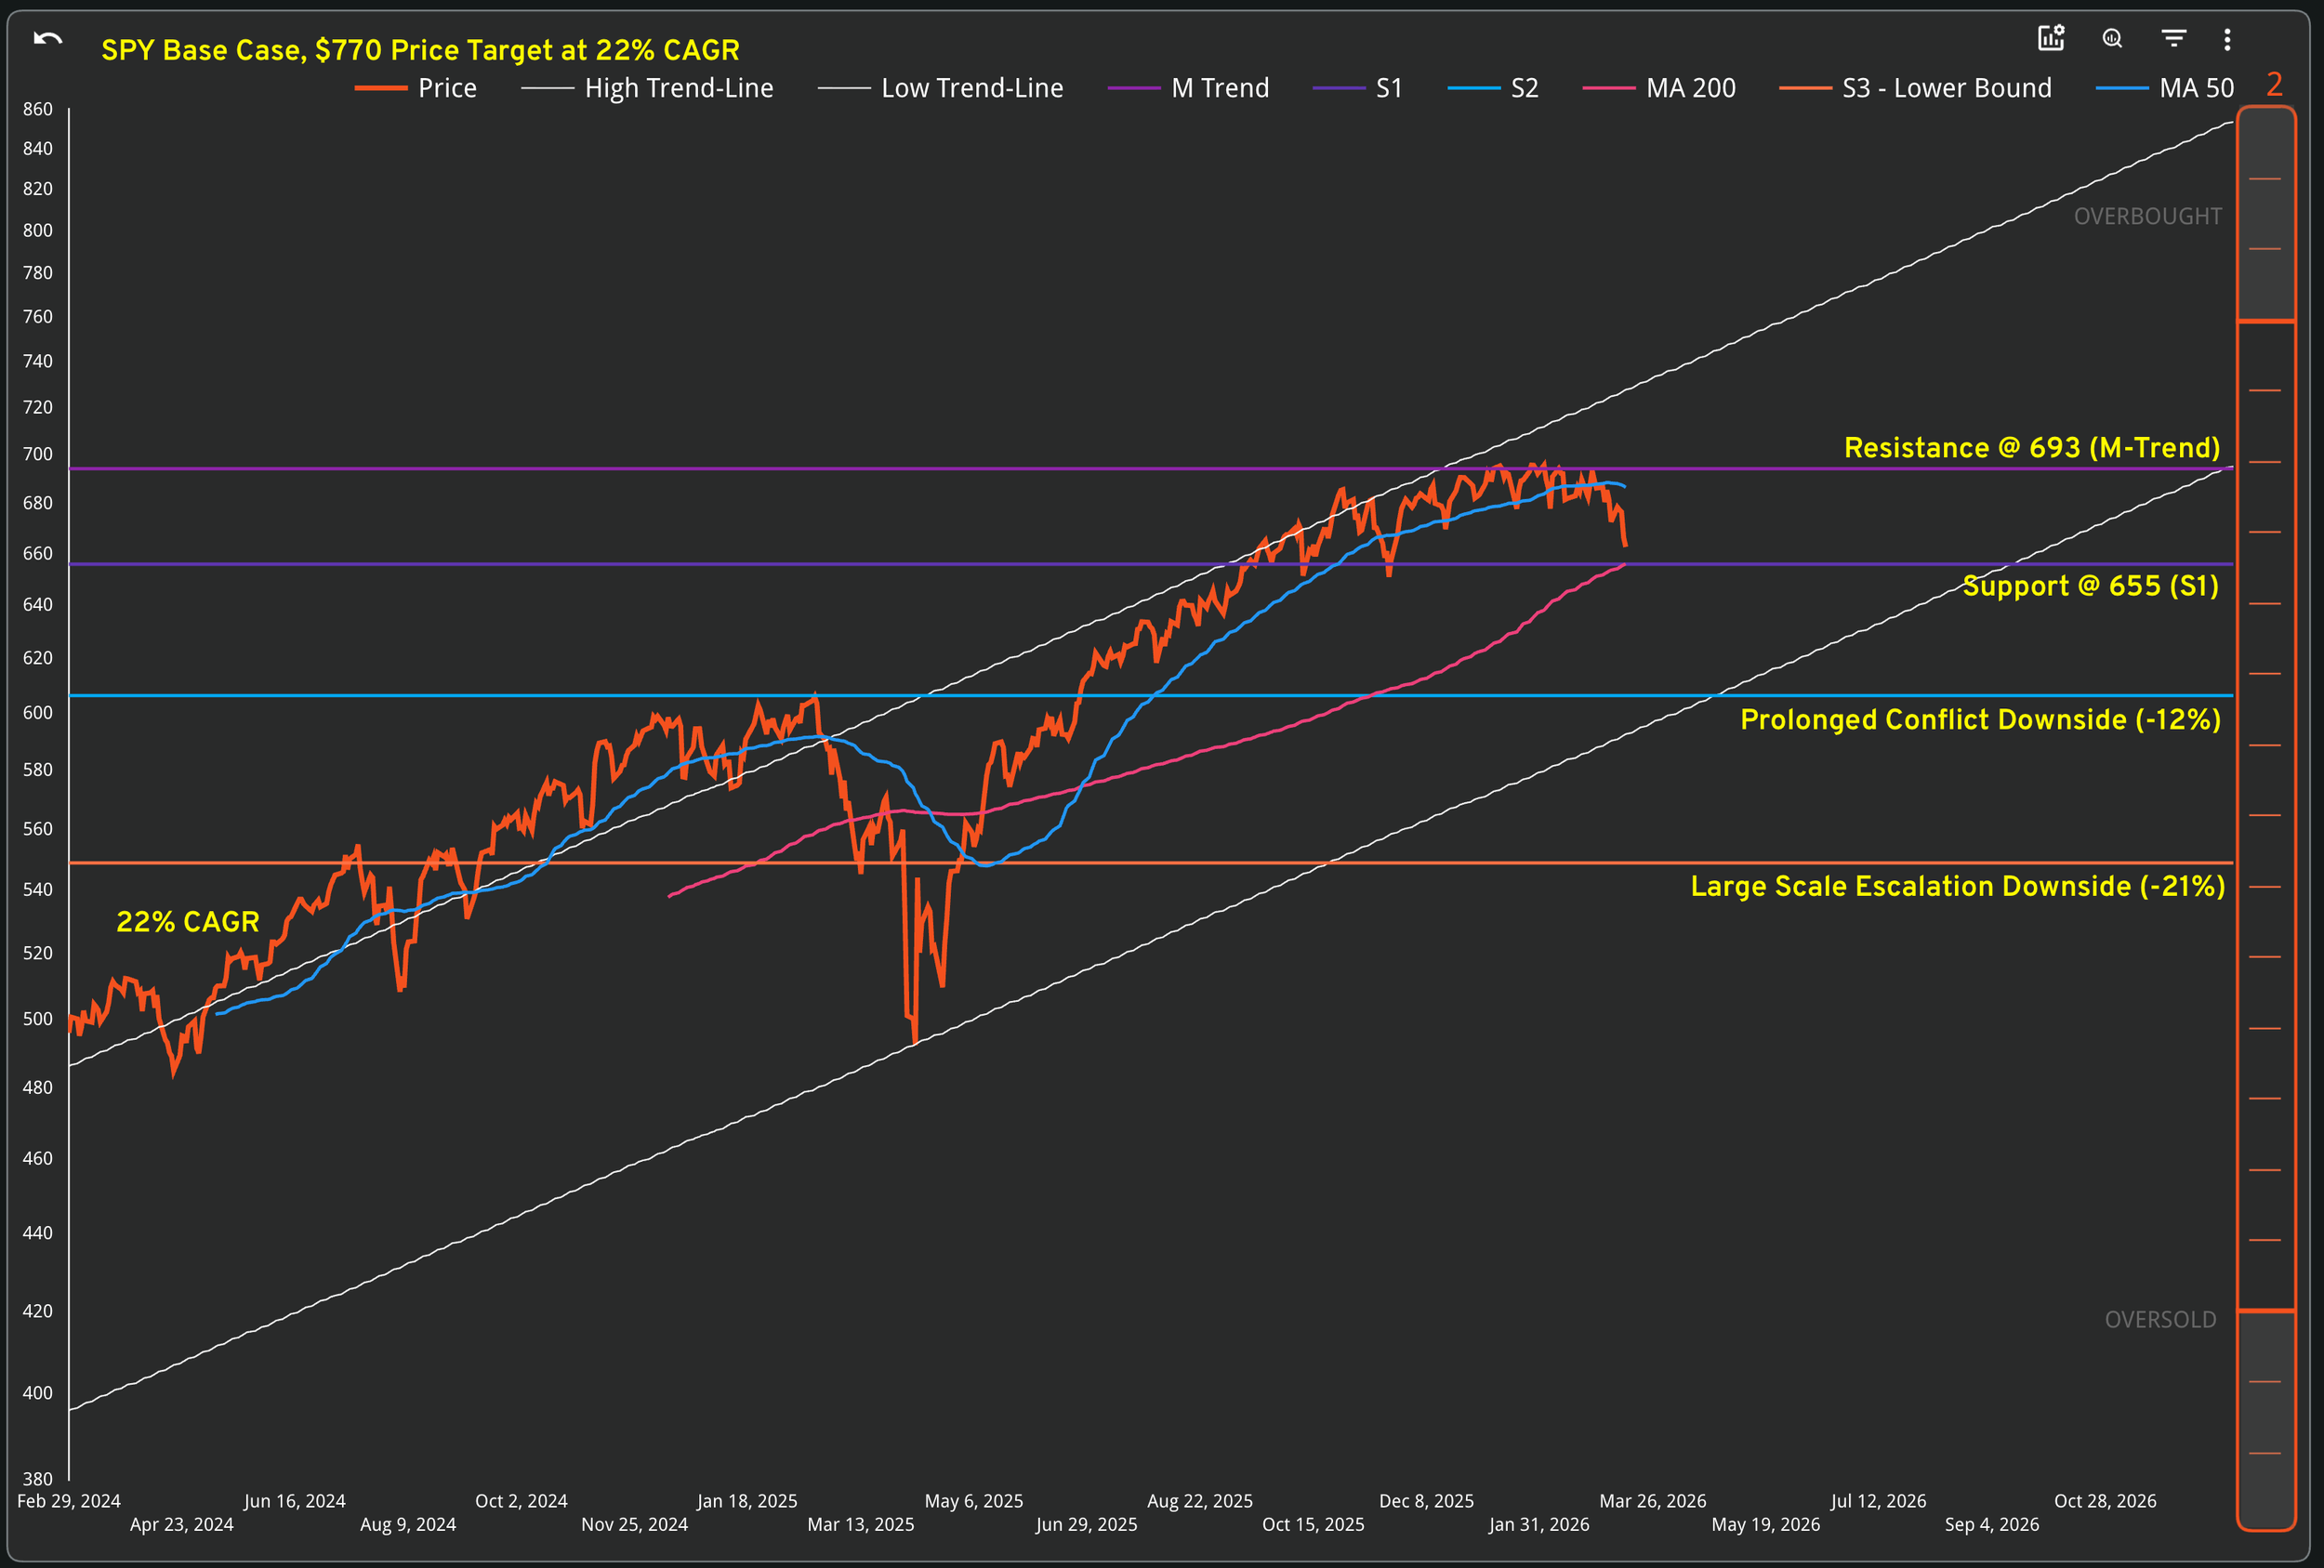
Technically speaking, the market is decently oversold in the medium and short term. There’s definitely fuel for a counter-trend rally on any bit of good news. To invalidate our bearish assumptions, we’d need to see SPY rally and close above the 50-DMA at $687. A key support test is coming up at the 200-DMA and S1 level (around $655) and there should be buyers ready to step in there.
Over the next two weeks we'll learn if this is a brief, sharp disruption that resolves quickly or the start of a more prolonged repricing cycle. If the strait remains closed for anywhere between 2-4 months (most likely), we could see a -12% -15% drawdown in SPY to the $600 area.
If the conflict escalates unpredictably (Russia or China intervention) or drags on longer than 4 months, we are likely to see a recession in the US, accompanied by a full cycle of earnings downgrades and a bear market. This could take the benchmark ETF anywhere from -25% to -35% in total drawdown, to the $500 - $550 area.
Our Trading Strategy (Sigma Portfolio)
Oil prices remain the key driver for the markets in the near term. As the market approaches oversold levels, the odds of a reflexive rally are increasing.
We have already bolstered cash reserves and took profits on some of our equity positions last Thursday. Bonds are not in a good spot either, as the prospect of rising inflation will damage the performance at the long end of the curve.
At the moment, our actions are the equivalent of “tapping the brakes”. It puts us in a good position to brake harder, if required.
On the equities side, a break below $655 signals that we need to take more aggressive measures in portfolios. We are definitely not buying any dip at the moment, since the total drawdown is not nearly high enough to justify the risk.
As always, we’ll be looking to Enterprise as general guidance, with the various market studies mentioned contributing to the overall decision making. Similarly, we’ll also be tracking oil volatility for signals of escalation (or de-escalation). Some good news has the potential to hit the tape on Wednesday, as investors will be looking to Jerome Powell for guidance amid this conflict. Until further notice, rallies will be used for selling, not buying.
Disclosures / Disclaimers: This is not a solicitation to buy, sell, or otherwise transact any stock or its derivatives. Nor should it be construed as an endorsement of any particular investment or opinion of the stock’s current or future price. To be clear, I do not encourage or recommend for anyone to follow my lead on this or any other stocks, since I may enter, exit, or reverse a position at any time without notice, regardless of the facts or perceived implications of this blog post. I currently do not own or plan to own any position, long or short, in the securities mentioned.
I am not a financial advisor licensed in the United States. Nor am I providing any recommendations, price targets, or opinions about valuation regarding the companies discussed herein. Any disclosures regarding my holdings are true as of the time this article is written, but subject to change without notice. I frequently trade my positions, often on an intraday basis. Thus, it is possible that I might be buying and/or selling the securities mentioned herein and/or its derivative at any time, regardless of (and possibly contrary to) the content of this blog post.
I undertake no responsibility to update my disclosures and they may therefore be inaccurate thereafter. Likewise, any opinions are as of the date of publication, and are subject to change without notice and may not be updated. I believe that the sources of information I use are accurate but there can be no assurance that they are. All investments carry the risk of loss and the securities mentioned herein may entail a high level of risk. Investors considering an investment should perform their own research and consult with a qualified investment professional.
I wrote this blog post myself, and it expresses my own opinions. I do not have a business relationship with any company whose stock is mentioned in this blog post. The information in this blog post is for informational purposes only and should not be regarded as investment advice or as a recommendation regarding any particular security or course of action.
The primary purpose of this blog post is to share industry expertise and research and receive feedback (confirmation / refutation) regarding my investment theses.