/ May 18 / Weekly Preview
-
Monday:
NAHB Housing Market Index
---
Tuesday:
N/A
---
Wednesday:
FOMC Minutes
---
Thursday:
Housing Starts
Building Permits
---
Friday:
N/A
-
Monday:
Baidu, Inc.
Ryanair Holdings plc
---
Tuesday:
Home Depot, Inc. (The)
Keysight Technologies Inc.
---
Wednesday:
NVIDIA Corporation
Analog Devices, Inc.
---
Thursday:
Walmart Inc.
Deere & Company
---
Friday:
N/A
Risk Increases Into The Summer
Got a question about the markets, your investments, or a topic you’d like us to discuss in an upcoming article? We read every message and may feature your question in our daily write-ups!
Email: andrei@signal-sigma.com
Follow & DM on X: @signal_sigma
Last week, the S&P 500 touched on the historic level of 7,500 before eventually giving up that gain and closing at 7,408 following a sell-off on Friday. On the week, the gain was just +0.3%, with some technical analysis suggesting Thursday marked a “blow-off top”.
Inflation bears had a lot to chew on, with April CPI surging to +3.8% YoY and Core CPI at +2.8% YoY. Both readings were the highest since May 2023 and both came in above consensus. Energy drove more than 40% of the headline gain, with gas prices jumping 28.4% YoY, and real average hourly wages falling -0.3% annually. This means that inflation is now fully consuming wage gains for the first time in three years.
On Wednesday, PPI sounded the alarm. Wholesale inflation surged +6.0% YoY in April, with the monthly gain at +1.4%, the highest in almost 4 years. As the chart below shows, CPI and PPI are highly correlated series and economists are fully expecting the higher input prices for producers to translate into higher consumer prices in May.
10-Year treasury yields spiked to 4.49% in the mid-week, with rate cut odds collapsing to zero. It wasn’t enough to fully collapse sentiment in equities, as Thursday’s record-setting surge was driven partly by optimism on trade relations with China.
The Beijing summit had more of a symbolic significance than it being a substantial economic development. During the 2 hour bilateral meeting, Xi warned on the mishandling of Taiwan, while Trump addressed the Strait of Hormuz situation. China will not aid Iran with military equipment - a meaningful geopolitical data point, but not essential to the ongoing conflict.
Tariffs on Chinese goods remain high, averaging 47.5%, while two-way trade has slowed to $415 billion annually, well below the 2022 peak of $690 billion. The summit yielded stabilization of relations rather than a revitalization of economic ties.
Eventually, the risk-on mood soured, with Friday delivering a technical rejection and a sea of red in momentum names.
The S&P 500 declined -1.24% to 7,408.50, the Nasdaq slid -1.54%, and the Dow tumbled 537 points as ten sectors finished lower. Chip stocks led the rout: Intel dropped over -6%, AMD and Micron each fell more than -5%, and Nvidia lost -4.4% as investors rotated out of names that had driven the prior gamma-fueled rally. The Russell 2000 slumped more than -2%, recording its worst session since November 2025.
It was only a matter of time until sentiment eventually reversed. 3-Month XLK / SPY relative returns had already peaked at +18%, the highest value in the last decade and way above a +1.5 standard deviation band. There really is no historical precedent for this kind of deviation. Now, it invites the question: in what way does the relationship normalize? Does SPY catch up to Tech, while XLK trades sideways, or does Tech collapse into a profit-taking cascade, with SPY holding up better due to the inherent diversification of the index?
Our guess is that we’ll see a measure of both.
Tech led advances have not been bearish in the past. Whenever there was a period of outperformance in either XLK or QQQ, the longer term outcomes for both the market as well as momentum leaders was unequivocally bullish.
Ned Davis Research has produced the following stat, posted in a tweet by @ISABELNET_SA:
“When the Nasdaq‑100 rises +10-25% in a year, the gains are usually driven by just three stocks. That is the nature of cap‑weighted indices. Narrow breadth isn't a bug, it's the engine.”
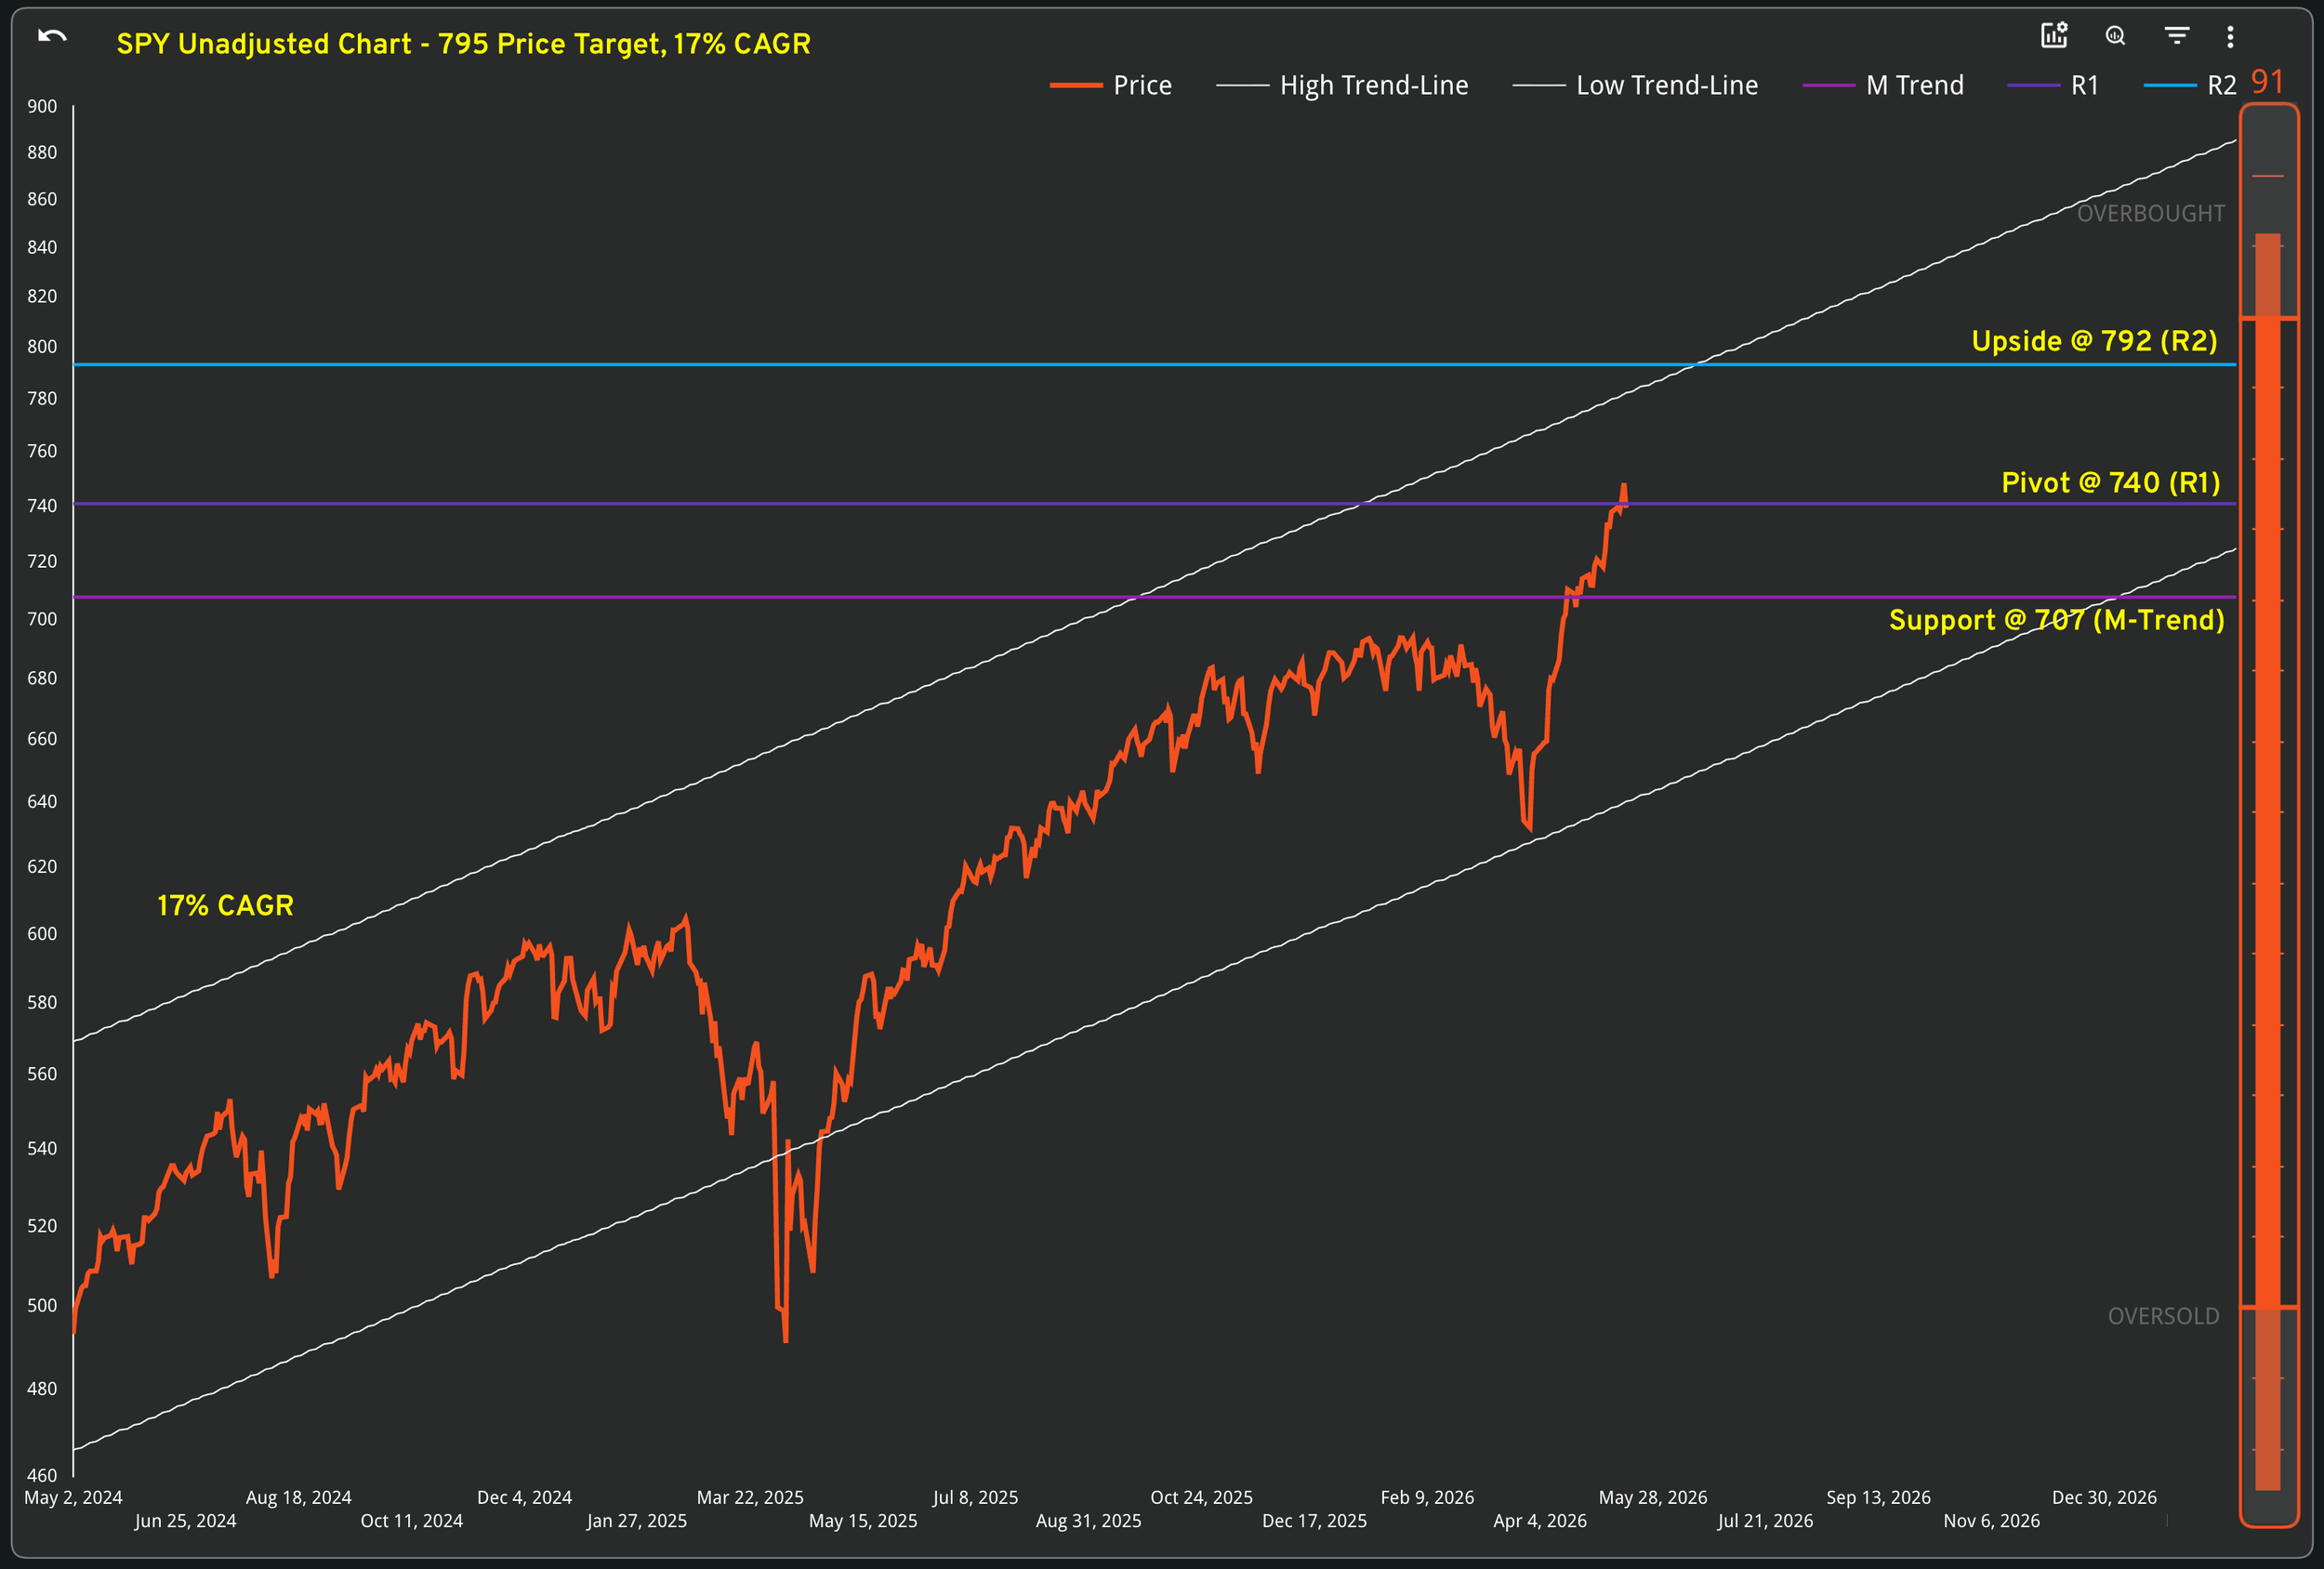
From a technical perspective, on Friday we got a retracement level rejection. SPY closed a hair lower than the R1 level at $740. Now, the most likely scenario becomes a pullback to the 20-DMA at $723, with more serious support coming in at $707 if that does not hold.
NVDA’s earnings on Wednesday may as well be the downside catalyst seeing that the post earnings reaction to the AI bellwether is historically bearish immediately on the next day of the announcement.
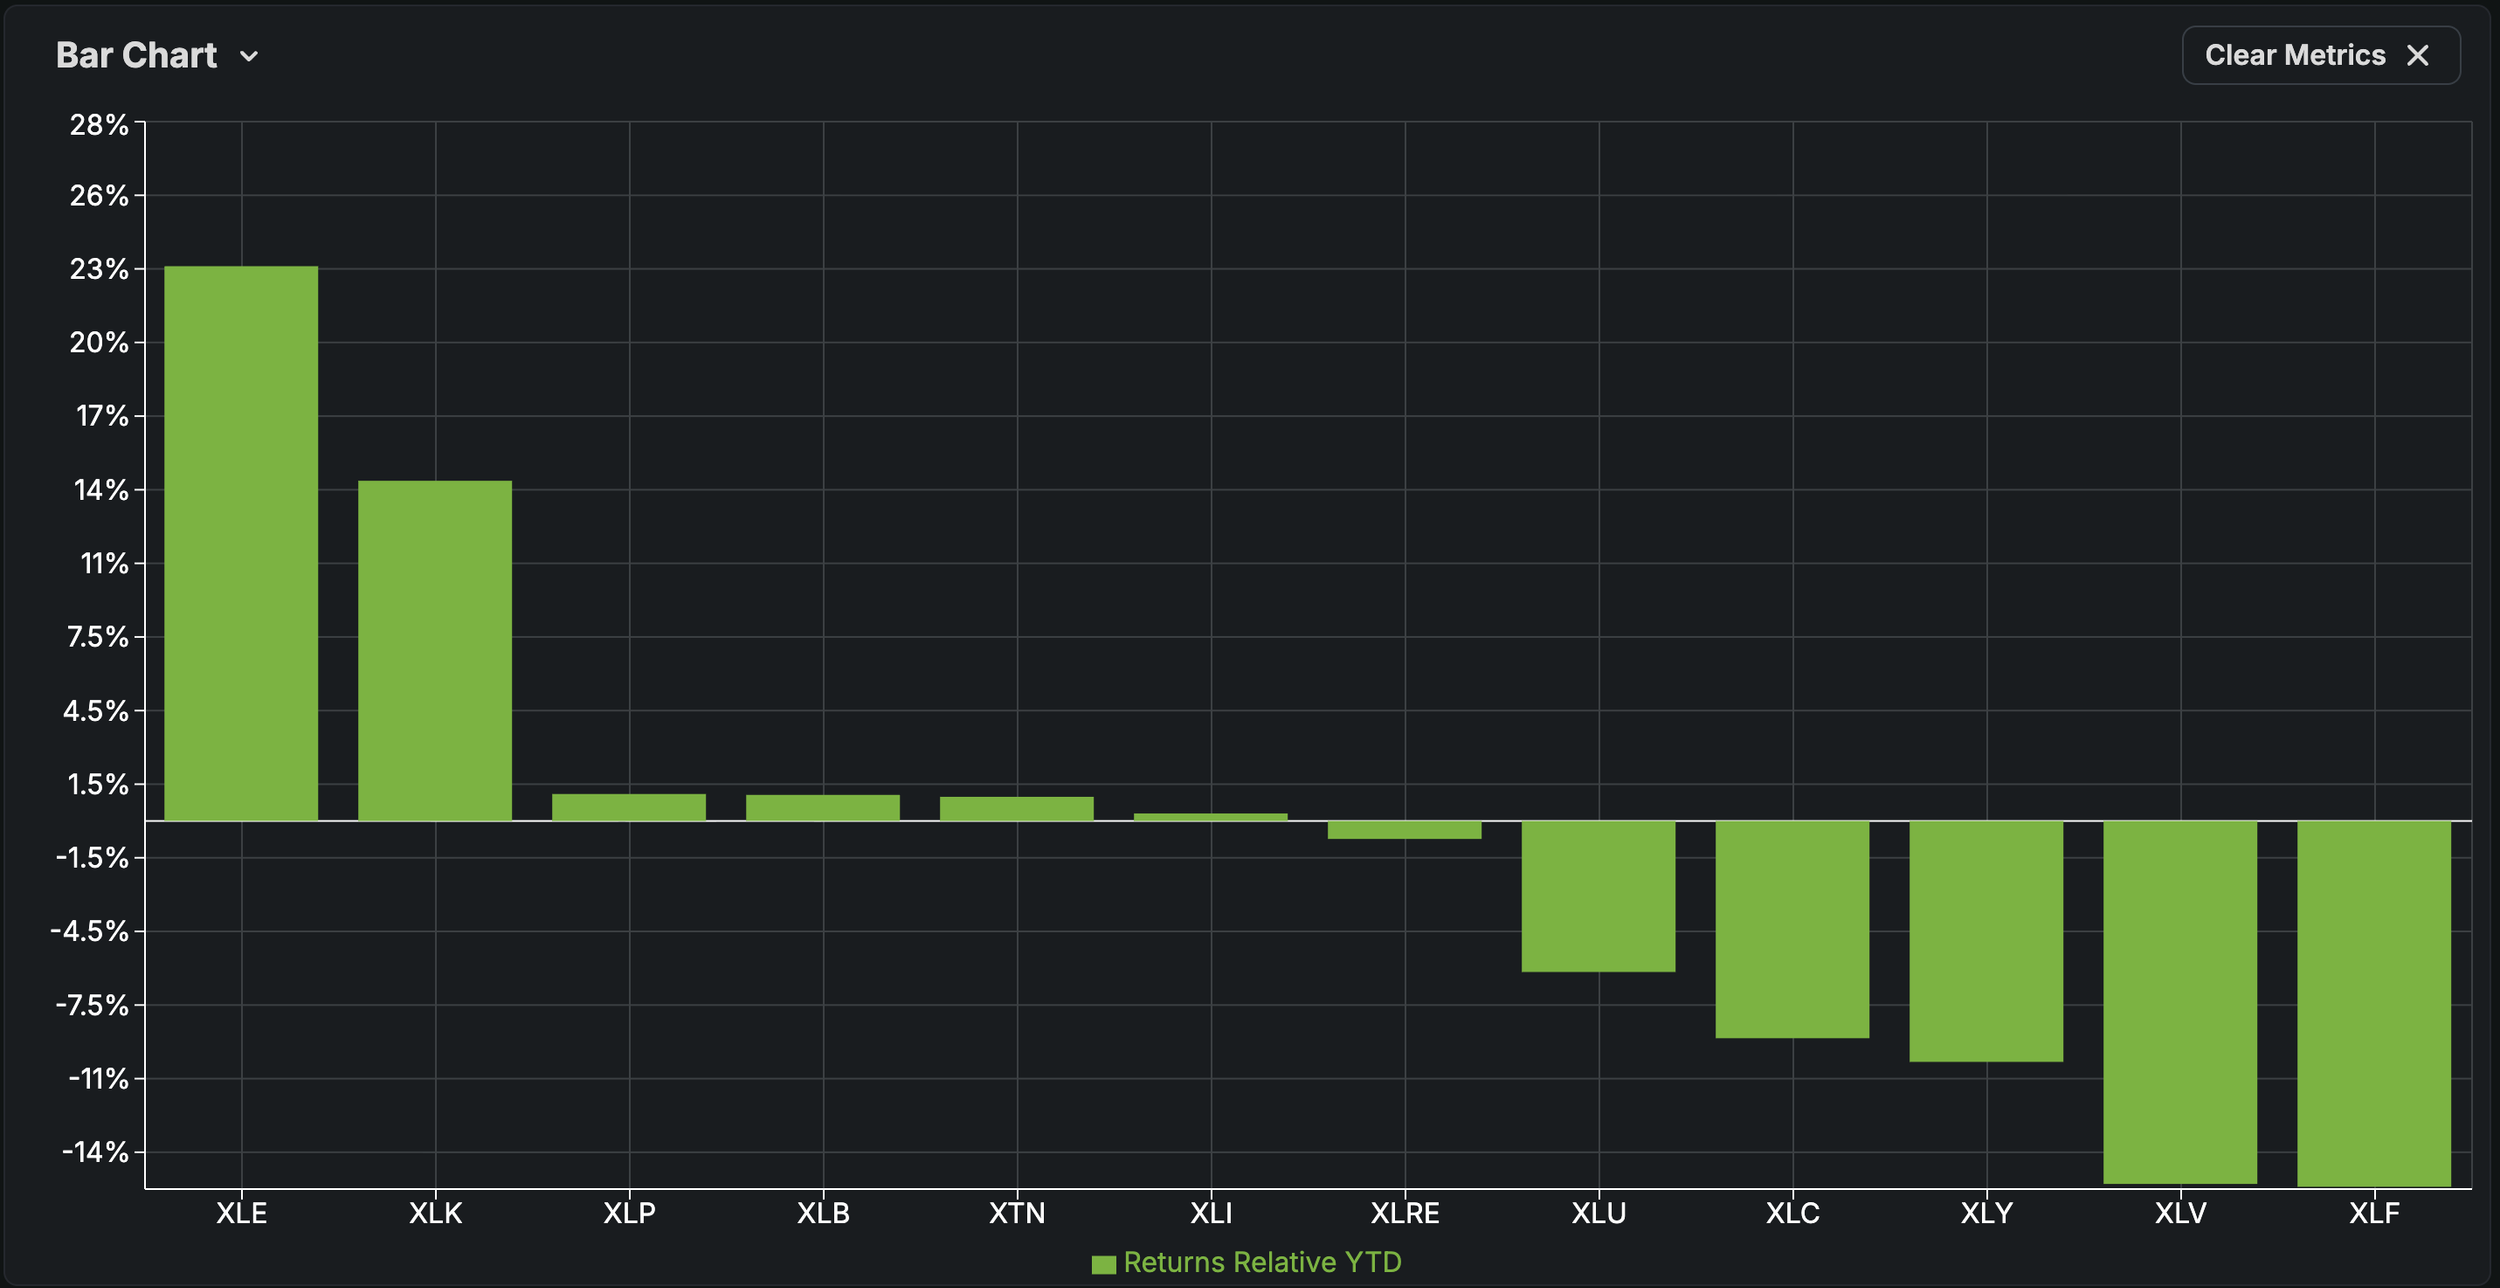
If we examine the drivers behind this year’s rally, market internals are much weaker than the headline would indicate. Through Friday’s close the S&P 500 is up about 8.4% year-to-date, but that gain is largely driven by a handful of sectors doing most of the work. Year-to-date performance for most market sectors is underwhelming when compared to SPY (relative returns for Sector ETFs are always relative to SPY).
With the exception of Energy (XLE) and Tech (XLK), investing in anything else would have either produced only marginally better returns or outright negative ones (Financials, Healthcare). Since Energy is only 4% of the S&P 500 by weight, the contribution to overall performance has been in the ballpark of +1%. Tech, on the other hand, accounts for 30% of the index weight. This year’s outperformance accounts for +6% of the index gain, with all of the other sectors contributing the remaining +1.4% returns.
If (and when) Tech corrects, so will the index. As such, the rally looks increasingly like a one trick pony, with little participation from the broad market.
A cursory glance at the chart for Tech (XLK) tells you all you need to know. A correction from this level looks all but inevitable. Right…?
Well… yes and no. We’ve created a study using XLK’s absolute Z-Score deviation as a signal generator, whenever it crosses the +1.1 threshold (lower panel). The historical results following such a signal tend to be weaker in the immediate term (up to 1-month) and stellar longer term (3-12 months).
While average SPY gains at the 1-month interval are negative (-0.36%, 56% positive), the 1 year average goes to +23% and a 100% win ratio.
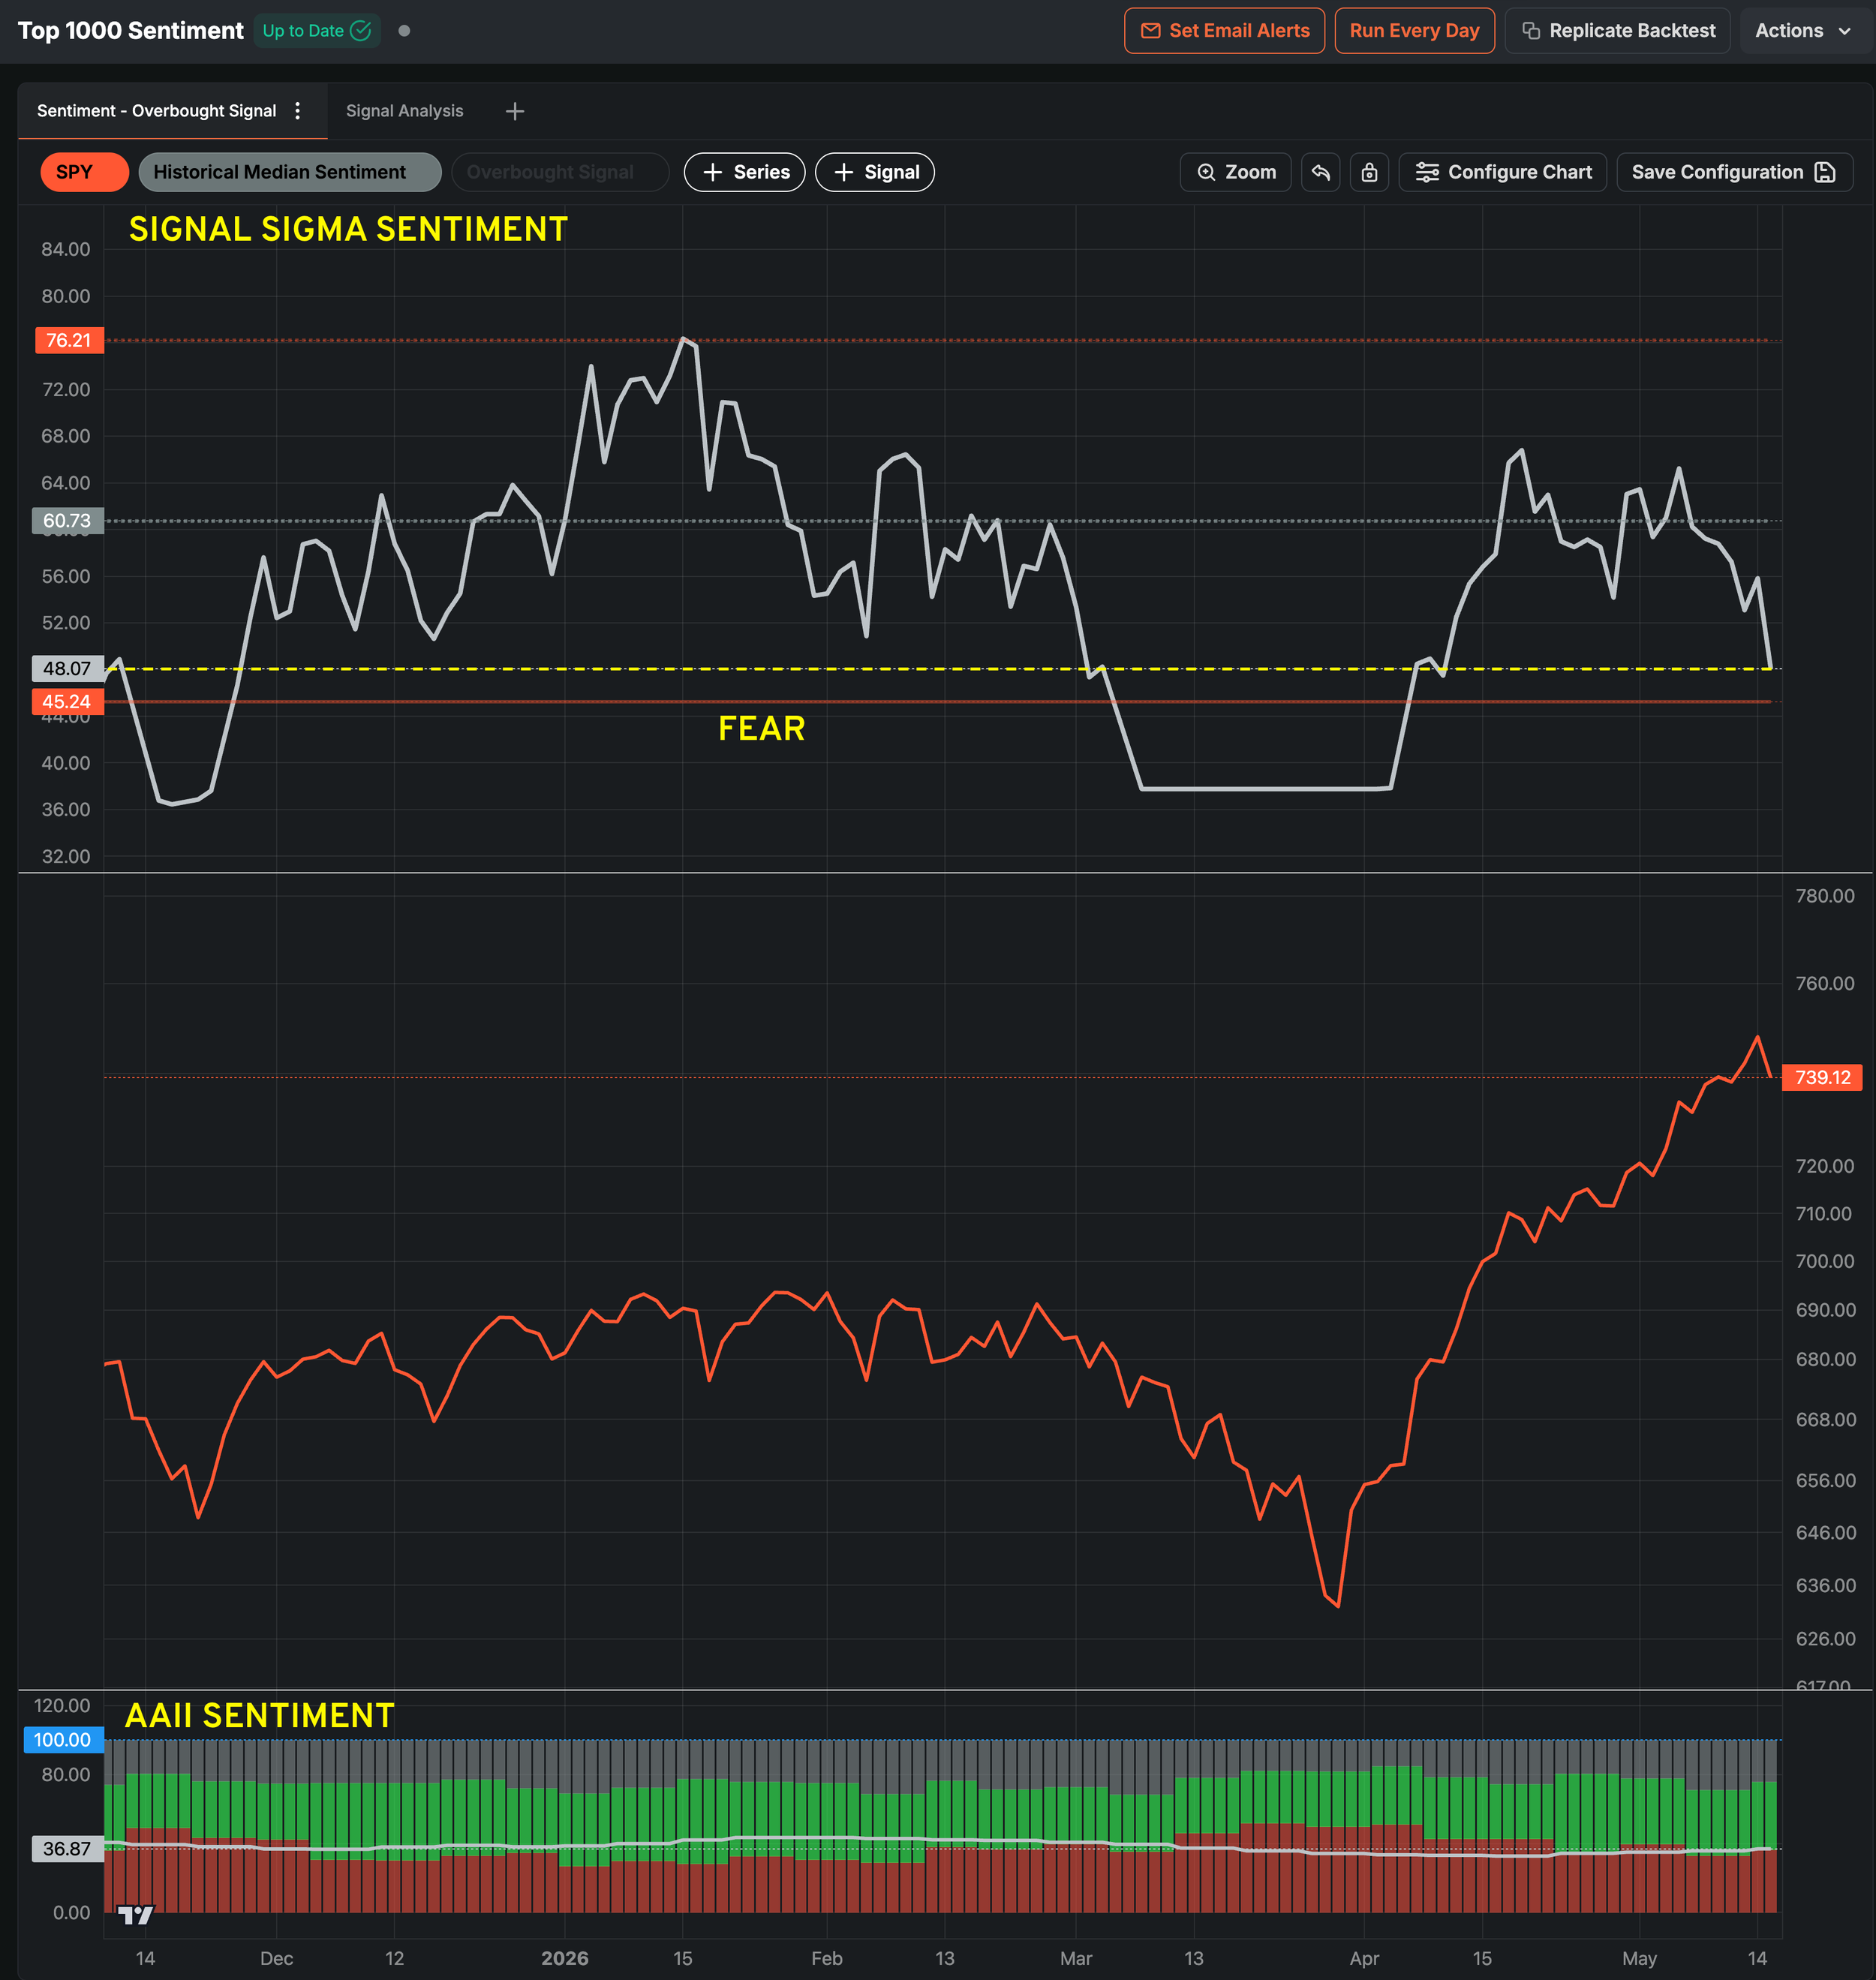
Investor sentiment is bearish-neutral currently (not a sign of euphoria or a true blow-off top). Our own sentiment reading suggests near FEAR levels of positioning (upper panel). AAII data (lower panel) likewise shows lukewarm, but improving sentiment in the market. Our interpretation is one of skepticism rather than everybody being in the same boat (on the long side).
The latest Commitments of Traders (COT) report gives credence to our thesis. These reports provide a snapshot of open interest in U.S. futures markets, broken down by the types of market participants holding those positions. There are 3 types of investors tracked:
Commercial Traders (Hedgers): Entities with a direct business interest in the underlying commodity (e.g., farmers, oil producers);
Non-Commercial Traders (Large Speculators): Large traders without a direct commercial interest, such as hedge funds, investment managers;
Non-Reportable Positions (Small Traders): Everyone else—typically smaller speculators or retail traders.
Among these categories, the most relevant are Non-Commercial Traders (hedge funds, blue bars on the chart below). They have never been more short Nasdaq futures since 2023.
Statistics from Deutsche Bank also show high but not exaggerated investor positioning (64’th percentile for automated strategies, 58’th percentile for discretionary investors). During previous episodes of violent reversion, positioning was significantly higher.
Furthermore, a study from Carson reveals that rallies seldom end in May and a bull market has never once topped in June for the full year.
Our Trading Strategy (Sigma Portfolio)
We have recently increased equity risk in our live portfolio using a breakout rationale. Though the breakout did not hold for now, the actions we took in the Sigma Portfolio reflect a belief that the top is not in, for now. We did take profits in positions that were extended (Micron, AAOI, WDC, etc.) and added some defensive names (LLY, AAPL). Our own Enterprise model is fully risk-on for now, giving credence to the bull thesis.
There is certainly an increased risk of choppy markets ahead. We are mentally prepared to face this volatility, which is especially tilted to the end of the week. The possibility of a full-on reversal seems unlikely for now, as there are plenty of investors “on the fence”, looking to get in on the bull train. These investors should be the ones providing a bid in the near term.
Besides NVDA’s earnings this week, we’ll also look at Walmart (WMT), providing a read on the consumer’s health. The big question will be how much tariff and inflation costs are being passed through at the shelf level versus absorbed in margin. Are consumers doing fine with $100 oil and 4.55% Treasury yields? Anecdotally, looking at the Swatch x AP Royal Pop launch this weekend (a $400 plastic designer watch, basically), we would think that they are doing alright.
Saturday, a new Fed Chair took over with a fundamentally different worldview. But we’ll worry about that later.
Disclosures / Disclaimers: This is not a solicitation to buy, sell, or otherwise transact any stock or its derivatives. Nor should it be construed as an endorsement of any particular investment or opinion of the stock’s current or future price. To be clear, I do not encourage or recommend for anyone to follow my lead on this or any other stocks, since I may enter, exit, or reverse a position at any time without notice, regardless of the facts or perceived implications of this blog post. I currently do not own or plan to own any position, long or short, in the securities mentioned.
I am not a financial advisor licensed in the United States. Nor am I providing any recommendations, price targets, or opinions about valuation regarding the companies discussed herein. Any disclosures regarding my holdings are true as of the time this article is written, but subject to change without notice. I frequently trade my positions, often on an intraday basis. Thus, it is possible that I might be buying and/or selling the securities mentioned herein and/or its derivative at any time, regardless of (and possibly contrary to) the content of this blog post.
I undertake no responsibility to update my disclosures and they may therefore be inaccurate thereafter. Likewise, any opinions are as of the date of publication, and are subject to change without notice and may not be updated. I believe that the sources of information I use are accurate but there can be no assurance that they are. All investments carry the risk of loss and the securities mentioned herein may entail a high level of risk. Investors considering an investment should perform their own research and consult with a qualified investment professional.
I wrote this blog post myself, and it expresses my own opinions. I do not have a business relationship with any company whose stock is mentioned in this blog post. The information in this blog post is for informational purposes only and should not be regarded as investment advice or as a recommendation regarding any particular security or course of action.
The primary purpose of this blog post is to share industry expertise and research and receive feedback (confirmation / refutation) regarding my investment theses.