/ April 20 / Weekly Preview
-
Monday:
N/A
---
Tuesday:
Retail Sales MoM (1.3% exp)
Pending Home Sales YoY
---
Wednesday:
N/A
---
Thursday:
Initial Jobless Claims (212K exp.)
---
Friday:
N/A
-
Monday:
Steel Dynamics, Inc.
---
Tuesday:
GE Aerospace
UnitedHealth Group Incorporated
RTX Corporation
Intuitive Surgical, Inc.
---
Wednesday:
Tesla, Inc.
Lam Research Corporation
GE Vernova Inc.
Philip Morris International Inc
International Business Machines Corporation
---
Thursday:
Intel Corporation
American Express Company
Thermo Fisher Scientific Inc
NextEra Energy, Inc.
---
Friday:
Procter & Gamble Company (The)
Southern Copper Corporation
HCA Healthcare, Inc.
Short Covering or New Bull Market?
Got a question about the markets, your investments, or a topic you’d like us to discuss in an upcoming article? We read every message and may feature your question in our daily write-ups!
Email: andrei@signal-sigma.com
Follow & DM on X: @signal_sigma
The market made history last week, as all losses from the Iran war were recovered in a record amount amount of time and new highs were established. Driving the tremendous rally were a mix of favorable geopolitical headlines, mechanical short covering as well as genuine fundamental improvements.
Initially, there were reports that Iran had reached out to the Trump admin despite a US naval blockade of the Strait of Hormuz. By Wednesday, both the S&P 500 and the Nasdaq Composite cleared fresh all-time highs, as investors anticipated a permanent peace deal to end the conflict. Due to the large underweight positioning of hedge funds and institutions, CTAs had to aggressively revert portfolios. These managers bought roughly $86 billion in equities last week, and positioning data shows about $70 billion more in programmatic buying set to deploy over the next five sessions.
This activity reflects forced covering and large-scale momentum chasing rather than discretionary optimism, creating a significant mechanical tailwind for markets into next week even if geopolitical developments slow sentiment.
Additionally, earnings data added a fundamental layer of optimism to the mechanical flows.
JPMorgan Chase topped expectations across the board, posting $5.94 EPS versus a $5.45 estimate and revenue of $50.54 billion. CEO Jamie Dimon, however, tempered enthusiasm by lowering net interest income guidance and warning of an “increasingly complex set of risks.” Citigroup and BlackRock also beat estimates. Goldman Sachs missed on FICC revenue despite record equities trading, dragging its stock down nearly 2%. Wells Fargo fell more than 5% after a weak print.
Outside of banking, Netflix beat on revenue and earnings but issued guidance that disappointed investors. Overall, about 80% of S&P 500 companies have beaten EPS estimates so far, by an average of 15.7%, supporting FactSet’s expectation of a sixth straight quarter of double-digit earnings growth.
On Friday, Axios reported that the U.S. and Iran are negotiating a three-page memorandum of understanding. The deal would release $20B in frozen Iranian funds against the surrender of Iran’s enriched uranium stockpile and the opening of the Strait of Hormuz. WTI crude plunged -11% on the news while stocks surged.
A durable Hormuz deal changes the inflation math meaningfully. Higher inflation is the primary driver of stagflation risk and Fed hawkishness. If tanker traffic normalizes in the next period, March CPI will be the last energy-driven high inflation print. If oil prices continue to decline, the Fed’s path to rate cuts opens up again.
As earnings track ahead of estimates, amid a bullish flow from CTA buyers and constructive geopolitics, the bull case is stronger than it has ever been this year.
On Friday, SPY closed at $710.05, marking a +12% rally from the March lows in under 15 trading sessions. This is one of the sharpest V-shaped recoveries in modern market history. QQQ posted 13 consecutive positive sessions. The only similar streak in the last 15 years happened on July 12 2013 following a correction of nearly -6% from the ATH established on 20 May 2013.
What followed was a brief -1.6% pullback over the next 6 sessions. The bull market then resumed, going on to gain +18% by December 31’st (second chart, signals to the extreme left).
With the VIX now collapsing to 17 and oil pulling back below $100, market breadth has dramatically improved and it’s hard to understate the technical trend reversal.
However, the key question that investors face is whether the breakout marks the resumption of the bull trend or we are only dealing with an oversized short covering rally that should be faded.
Going on the single historical sample analyzed above, it certainly makes sense that we should see at least a short term pullback sometime over the next 2 weeks. Stocks are stretched on nearly every short term measure, with the 20-Day Sigma Score of the non-defensive and non-energy Sectors ETFs averaging 0.82 / 1.00. Real Estate (XLRE), Transports (XTN) are maxed out on this measure, while risk-on drivers Tech (XLK), Communications (XLC) and Consumer Discretionary (XLY) also scoring very high.
In other words, there’s very little scope for short term gains, from a statistical perspective, with these same sectors vulnerable to profit-taking. The size of a pullback should not exceed 2-5% in the short term.
For SPY, technicals also indicate a potential -1.8% retracement to support, now at $697 (M-Trend). This is where the previous resistance level was established, just above the January ATH. This area should attract strong buying from under-allocated investors who missed the first leg of the rally. It also means the “easy money” phase of the melt-up is behind us.
Below this level, downside resides at the 50-DMA ($673), though it’s unlikely a pullback would reach that far. In any case, we would rather let the market “come to us” rather than chase momentum.
The main argument we’re making is that any pullback here is a genuine entry point and a place to add exposure to portfolios. Market breadth is the tell, and there’s no more potent indicator than the Russell 2000 index itself (IWM ETF) — now also at all-time-highs.
With +11% returns year-to-date, small caps lead the domestic Factors table, almost triple the returns of SPY. This no longer looks like a purely mechanical short-covering rally, as the average stock in the market is now outperforming the benchmark S&P 500 (and vastly outperforming Mega Caps, which are just +1.3% YTD).
Furthermore, our primary SELL signal (topping pattern breadth) is now back to healthy levels (lower is better), indicative of a genuine bull market resumption. Short-covering rallies tend to be narrow and not cause a collapse in this metric. In the 2022 bear market, despite intermittent rallies on SPY, this indicator remained stubbornly high, near the 400 mark. Now, only 70 stocks are trading in a topping pattern, similar to other continued bull markets of the past.
The earnings front is also confirming a more durable bull market.
Goldman Sachs keeps its year-end S&P 500 target at 7,600, based on projected 2026 EPS of $309 and assumed 12% earnings growth. They call the 12% growth a “fundamental floor,” arguing that it supports a continuing — but maturing — bull market by providing a safety net and a more sustainable transition rather than an end to the rally.
Goldman Sachs, Morgan Stanley, and JPMorgan all topped expectations, providing a timely boost to the market. Goldman reported EPS of $17.55 versus $16.47 expected; Morgan Stanley delivered $3.43 against a $3.02 forecast; JPMorgan exceeded expectations across nearly every metric. The strong bank results gave the financials sector a stabilizing, fundamentally driven lift just when markets needed it. As James “Rev Shark” DePorre noted, investors are wagering on long-term U.S. economic strength—with AI as the primary catalyst—while increasingly viewing tensions with Iran as a short-term distraction.
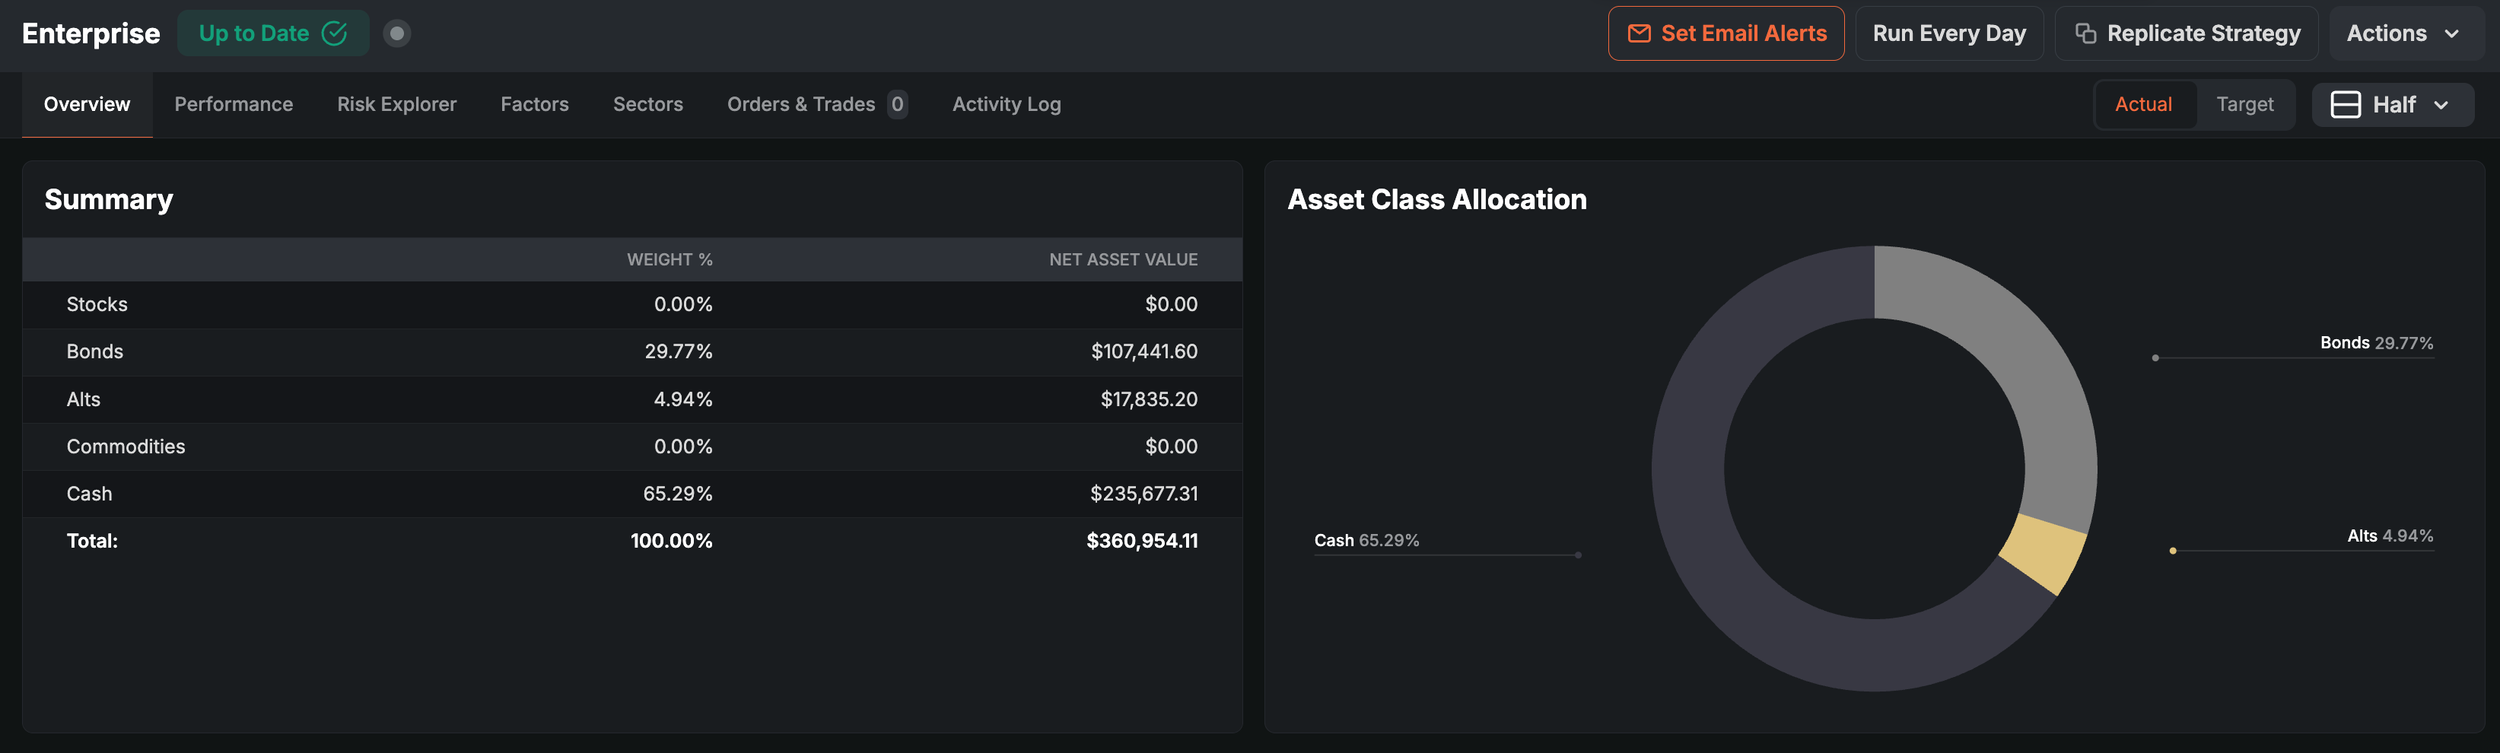
Our core asset allocation model (Enterprise) has taken profits on both its stocks and commodities positions, staying in 65% cash for a couple of sessions. This is not indicative of long term conviction, as both positions will be reinstated at Tuesday’s close. We can only surmise that, for the time being, both trades had run their course and a pause is welcomed a tactical trader such as Enterprise.
Our Trading Strategy (Sigma Portfolio)
As our portfolio is still firmly allocated risk-on, we have been making money on the way up. Lots of money (+25% YTD). Despite holding 20% in cash.
In other words, we are in absolutely no hurry to deploy this cash back into the market at current levels. Stocks don’t go in a single direction forever. We will patiently wait for a buyable dip to increase exposure back to 100%. We are not expecting any sizable pullback here, but one will eventually arrive.
The rally is real, but so is the FOMO chasing it.
Disclosures / Disclaimers: This is not a solicitation to buy, sell, or otherwise transact any stock or its derivatives. Nor should it be construed as an endorsement of any particular investment or opinion of the stock’s current or future price. To be clear, I do not encourage or recommend for anyone to follow my lead on this or any other stocks, since I may enter, exit, or reverse a position at any time without notice, regardless of the facts or perceived implications of this blog post. I currently do not own or plan to own any position, long or short, in the securities mentioned.
I am not a financial advisor licensed in the United States. Nor am I providing any recommendations, price targets, or opinions about valuation regarding the companies discussed herein. Any disclosures regarding my holdings are true as of the time this article is written, but subject to change without notice. I frequently trade my positions, often on an intraday basis. Thus, it is possible that I might be buying and/or selling the securities mentioned herein and/or its derivative at any time, regardless of (and possibly contrary to) the content of this blog post.
I undertake no responsibility to update my disclosures and they may therefore be inaccurate thereafter. Likewise, any opinions are as of the date of publication, and are subject to change without notice and may not be updated. I believe that the sources of information I use are accurate but there can be no assurance that they are. All investments carry the risk of loss and the securities mentioned herein may entail a high level of risk. Investors considering an investment should perform their own research and consult with a qualified investment professional.
I wrote this blog post myself, and it expresses my own opinions. I do not have a business relationship with any company whose stock is mentioned in this blog post. The information in this blog post is for informational purposes only and should not be regarded as investment advice or as a recommendation regarding any particular security or course of action.
The primary purpose of this blog post is to share industry expertise and research and receive feedback (confirmation / refutation) regarding my investment theses.