
-
Monday:
N/A
---
Tuesday:
Durable Goods Orders MoM (0.6% exp.)
Durable Goods Orders Ex Transp MoM (0.6% exp.)
CB Consumer Confidence (80.5 exp.)
New Home Sales (0.66M exp.)
---
Wednesday:
Goods Trade Balance Adv ($-128.7B exp.)
Fed Interest Rate Decision (4.0% exp.)
Fed Press Conference
---
Thursday:
GDP Growth Rate QoQ Adv (3.2% exp.)
Core PCE Price Index MoM (0.3% exp.)
Core PCE Price Index YoY (3.1% exp.)
PCE Price Index MoM (0.5% exp.)
Personal Income MoM (0.3% exp.)
Personal Spending MoM (0.3% exp.)
Initial Jobless Claims (196K exp.)
---
Friday:
Employment Cost Index QoQ (0.8% exp.)
Chicago PMI (55.9 exp.)
-
Monday:
Verizon (VZ)
Welltower (WELL)
Cadence Design Systems (CDNS)
Nucor (NUE)
Public Storage (PSA)
---
Tuesday:
Visa (V)
Coca-Cola (KO)
Boeing (BA)
PayPal (PYPL)
UPS
---
Wednesday:
Microsoft (MSFT)
Alphabet (GOOGL)
ServiceNow (NOW)
T-Mobile (TMUS)
Chipotle (CMG)
---
Thursday:
Amazon (AMZN)
Eli Lilly (LLY)
Mastercard (MA)
Merck (MRK)
Intel (INTC)
---
Friday:
ExxonMobil (XOM)
Chevron (CVX)
AbbVie (ABBV)
General Dynamics (GD)
Can Earnings Save A Red October?
Got a question about the markets, your investments, or a topic you’d like us to discuss in an upcoming article? We read every message and may feature your question in our daily write-ups!
Email: andrei@signal-sigma.com
Follow & DM on X: @signal_sigma
Over the past week, capital has rotated heavily within the market.
Defensive and cyclical sectors led a broad weekly rotation into real assets and yield-sensitive groups (Energy, Utilities, Real Estate), while high-beta momentum (Semiconductors, Communication Services) pulled back, signaling a defensive posture amid interest rate stabilization. Investors favored broader participation and value/small-cap cyclicals as rate volatility subsided, trimming exposure from crowded growth and momentum leaders.
In theory, the main catalyst for the tech rout was META. The company topped earnings expectations, but posted its first cash outflow in more than a decade, as AI-related spending exceeded incoming cash. It also unveiled a two-for-one stock split and plans to issue non-voting shares to help finance the expansion. Shares dropped -7% on Thursday, while the Philadelphia Semiconductor Index fell -6.7%. The Nasdaq Composite recorded its steepest decline since early June. On Friday, oil prices climbed further, with Brent settling at $116.72—a six-month high. The S&P 500 ended the week at 7,623.68, down -0.4% for its second consecutive weekly loss. The Dow, by contrast, rose about +1.4%.
Judging only by the headlines, you’d think Meta’s ER crashed the “AI story” overnight. It didn’t. This is the usual problem with media coverage: after the selloff had already occurred, outlets rush to find an explanation. Headlines then tend to get attached to a move once it’s already underway (and sometimes near its end). In reality, the selloff didn’t happen because of Meta. It simply needed a reason (any reason), and Meta happened to provide one.
At the start of the month (October 2, first chart), Tech (XLK) and Semis (SMH) were the only sectors recording positive monthly gains, while everything else was down for the month. Fast forward to today (second chart) and the same leaders have now turned to laggards, with most of everything else playing catch up. SMH has fallen -16.4%, XLK has fallen -8.3%, and the Nasdaq-100 ETF has lost -6.0%.
Conversely, the equal-weight S&P 500 and large-cap value each rose +3.2%, while energy (XLE) climbed +10.4%. From the perspective of the broad market, this is a rotation, not a liquidation.
October 2 Sector Returns 1-Month
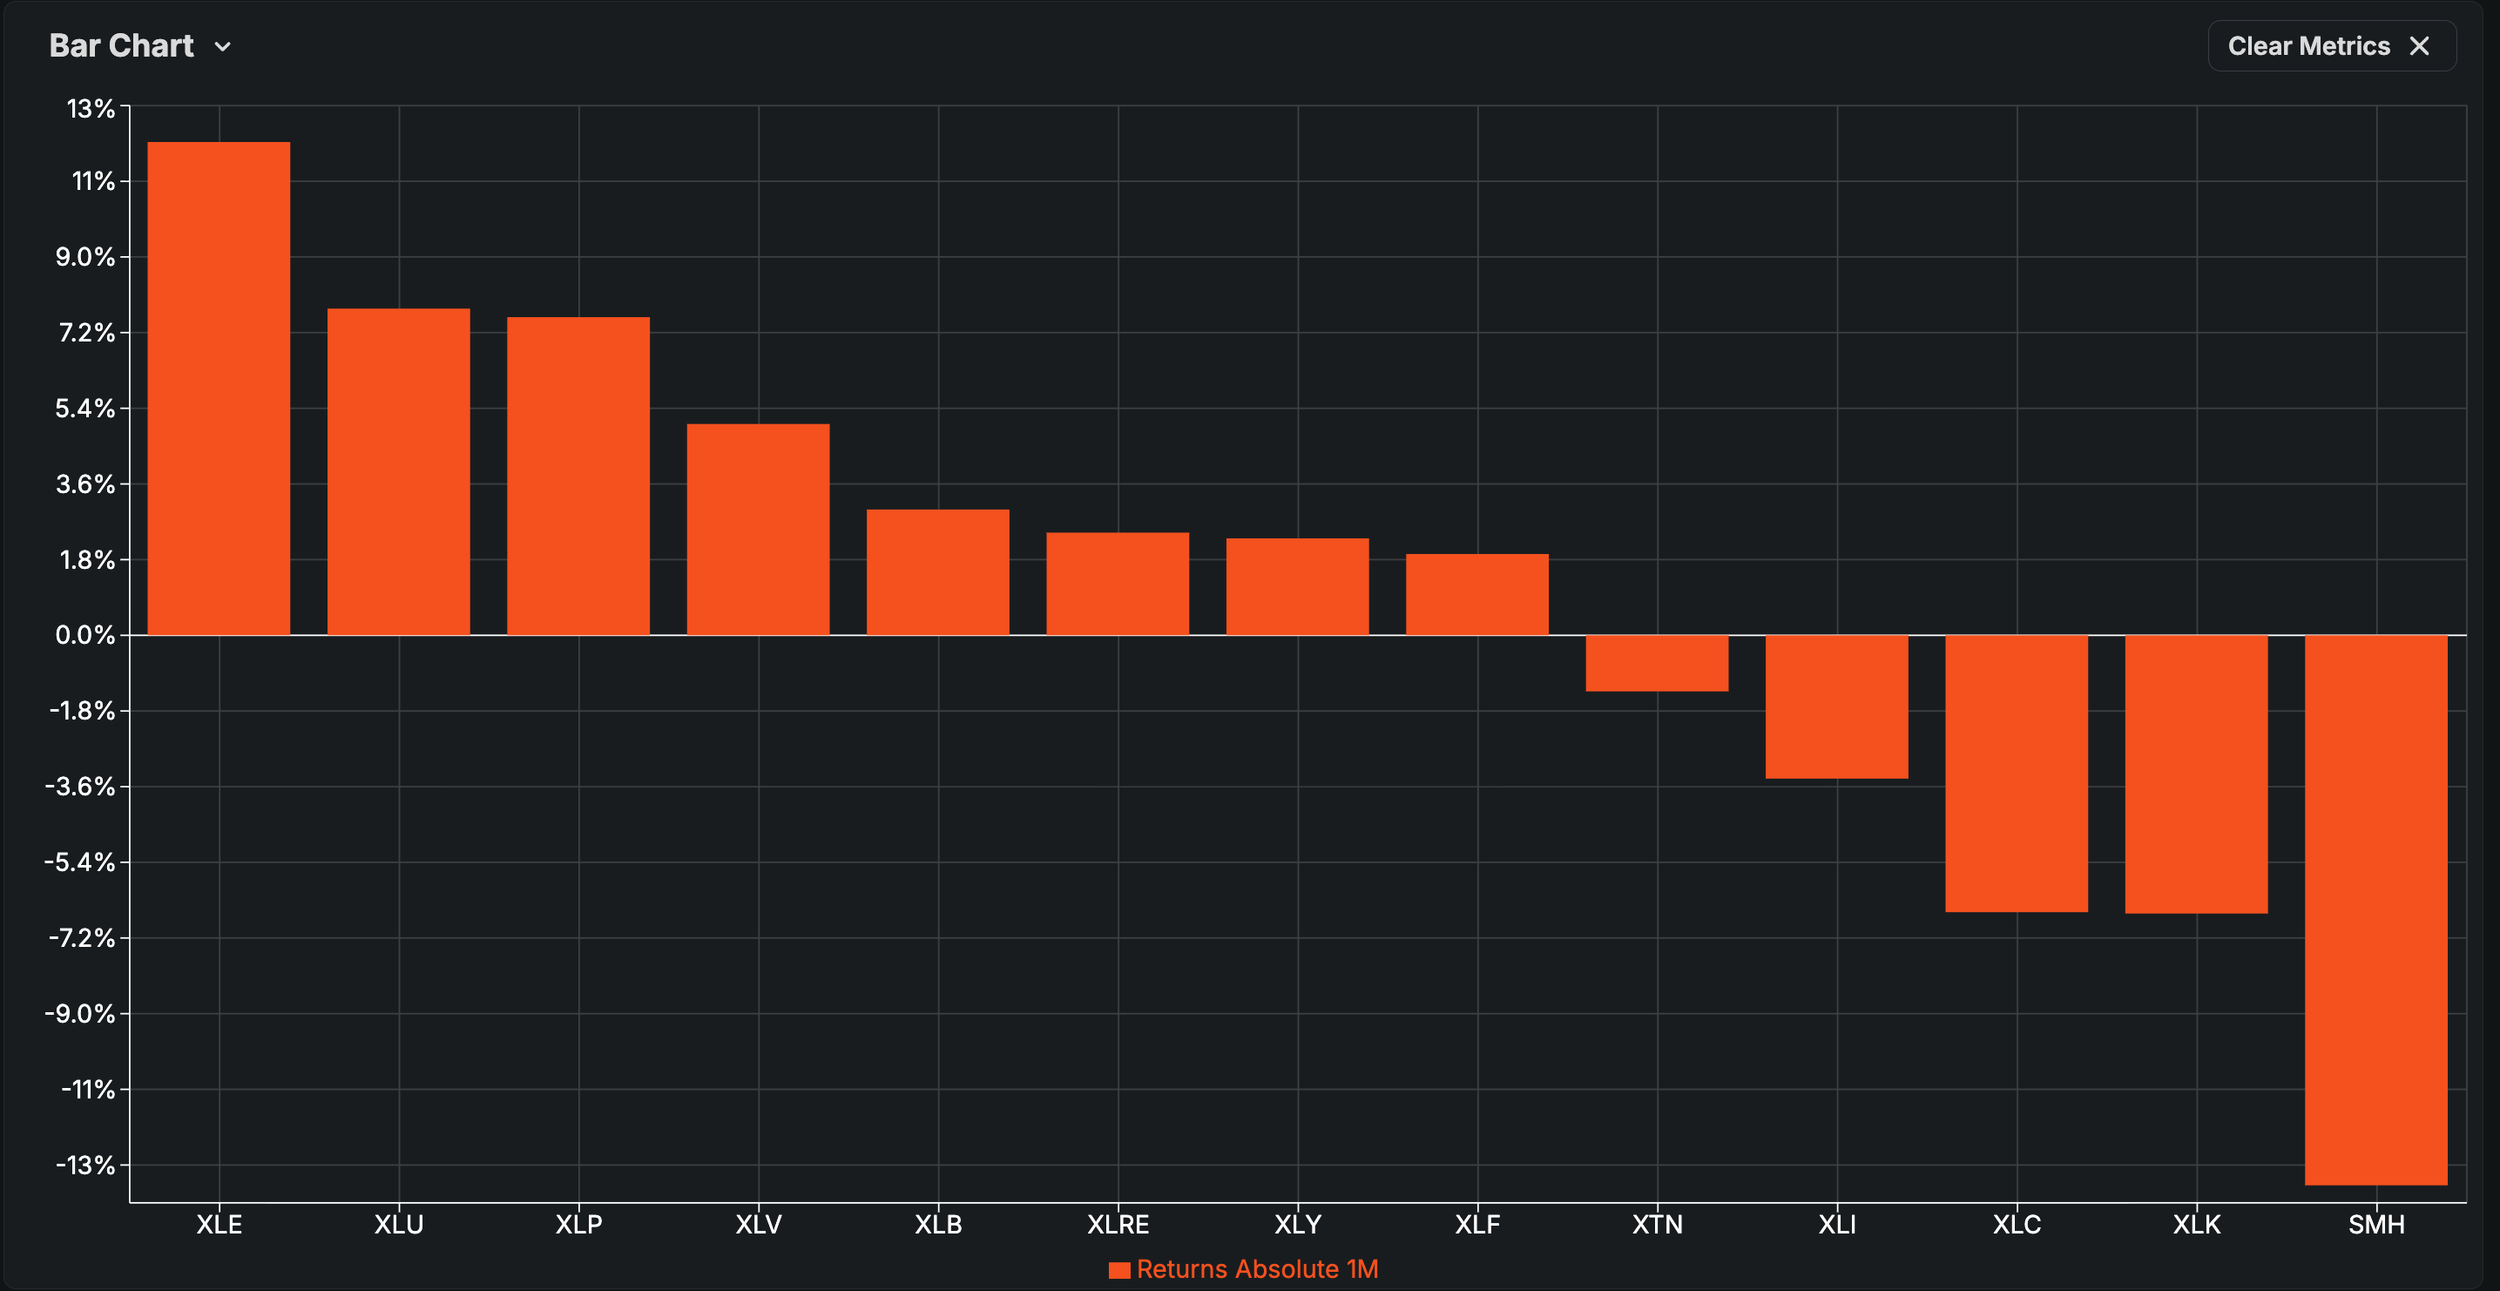
Present Day Sector Returns 1-Month
However, that rotation may well be in its final innings. Now, it’s Tech that’s starting to become decently oversold (with an RSI reading of just 24 and a 40-Day stochastic of just 8 / 100). SMH and communications (XLC), holding Meta and Alphabet, have even lower stochastic values, at just 5.61 and 0.2 respectively. Both the weekly and the daily MACD indicators are negative for this group.
The sigma scores (measuring the normalized deviation from each moving average) are not washed out to the negative side just yet, but they are getting close.
Meanwhile, it’s the defensive trade that’s getting crowded, with Healthcare (XLV), Staples (XLP), and Utilities (XLU) topping the momentum charts. It feels like crisis in the sectors getting hit and safety in the sectors that are doing well. Such is the nature of every rotation.
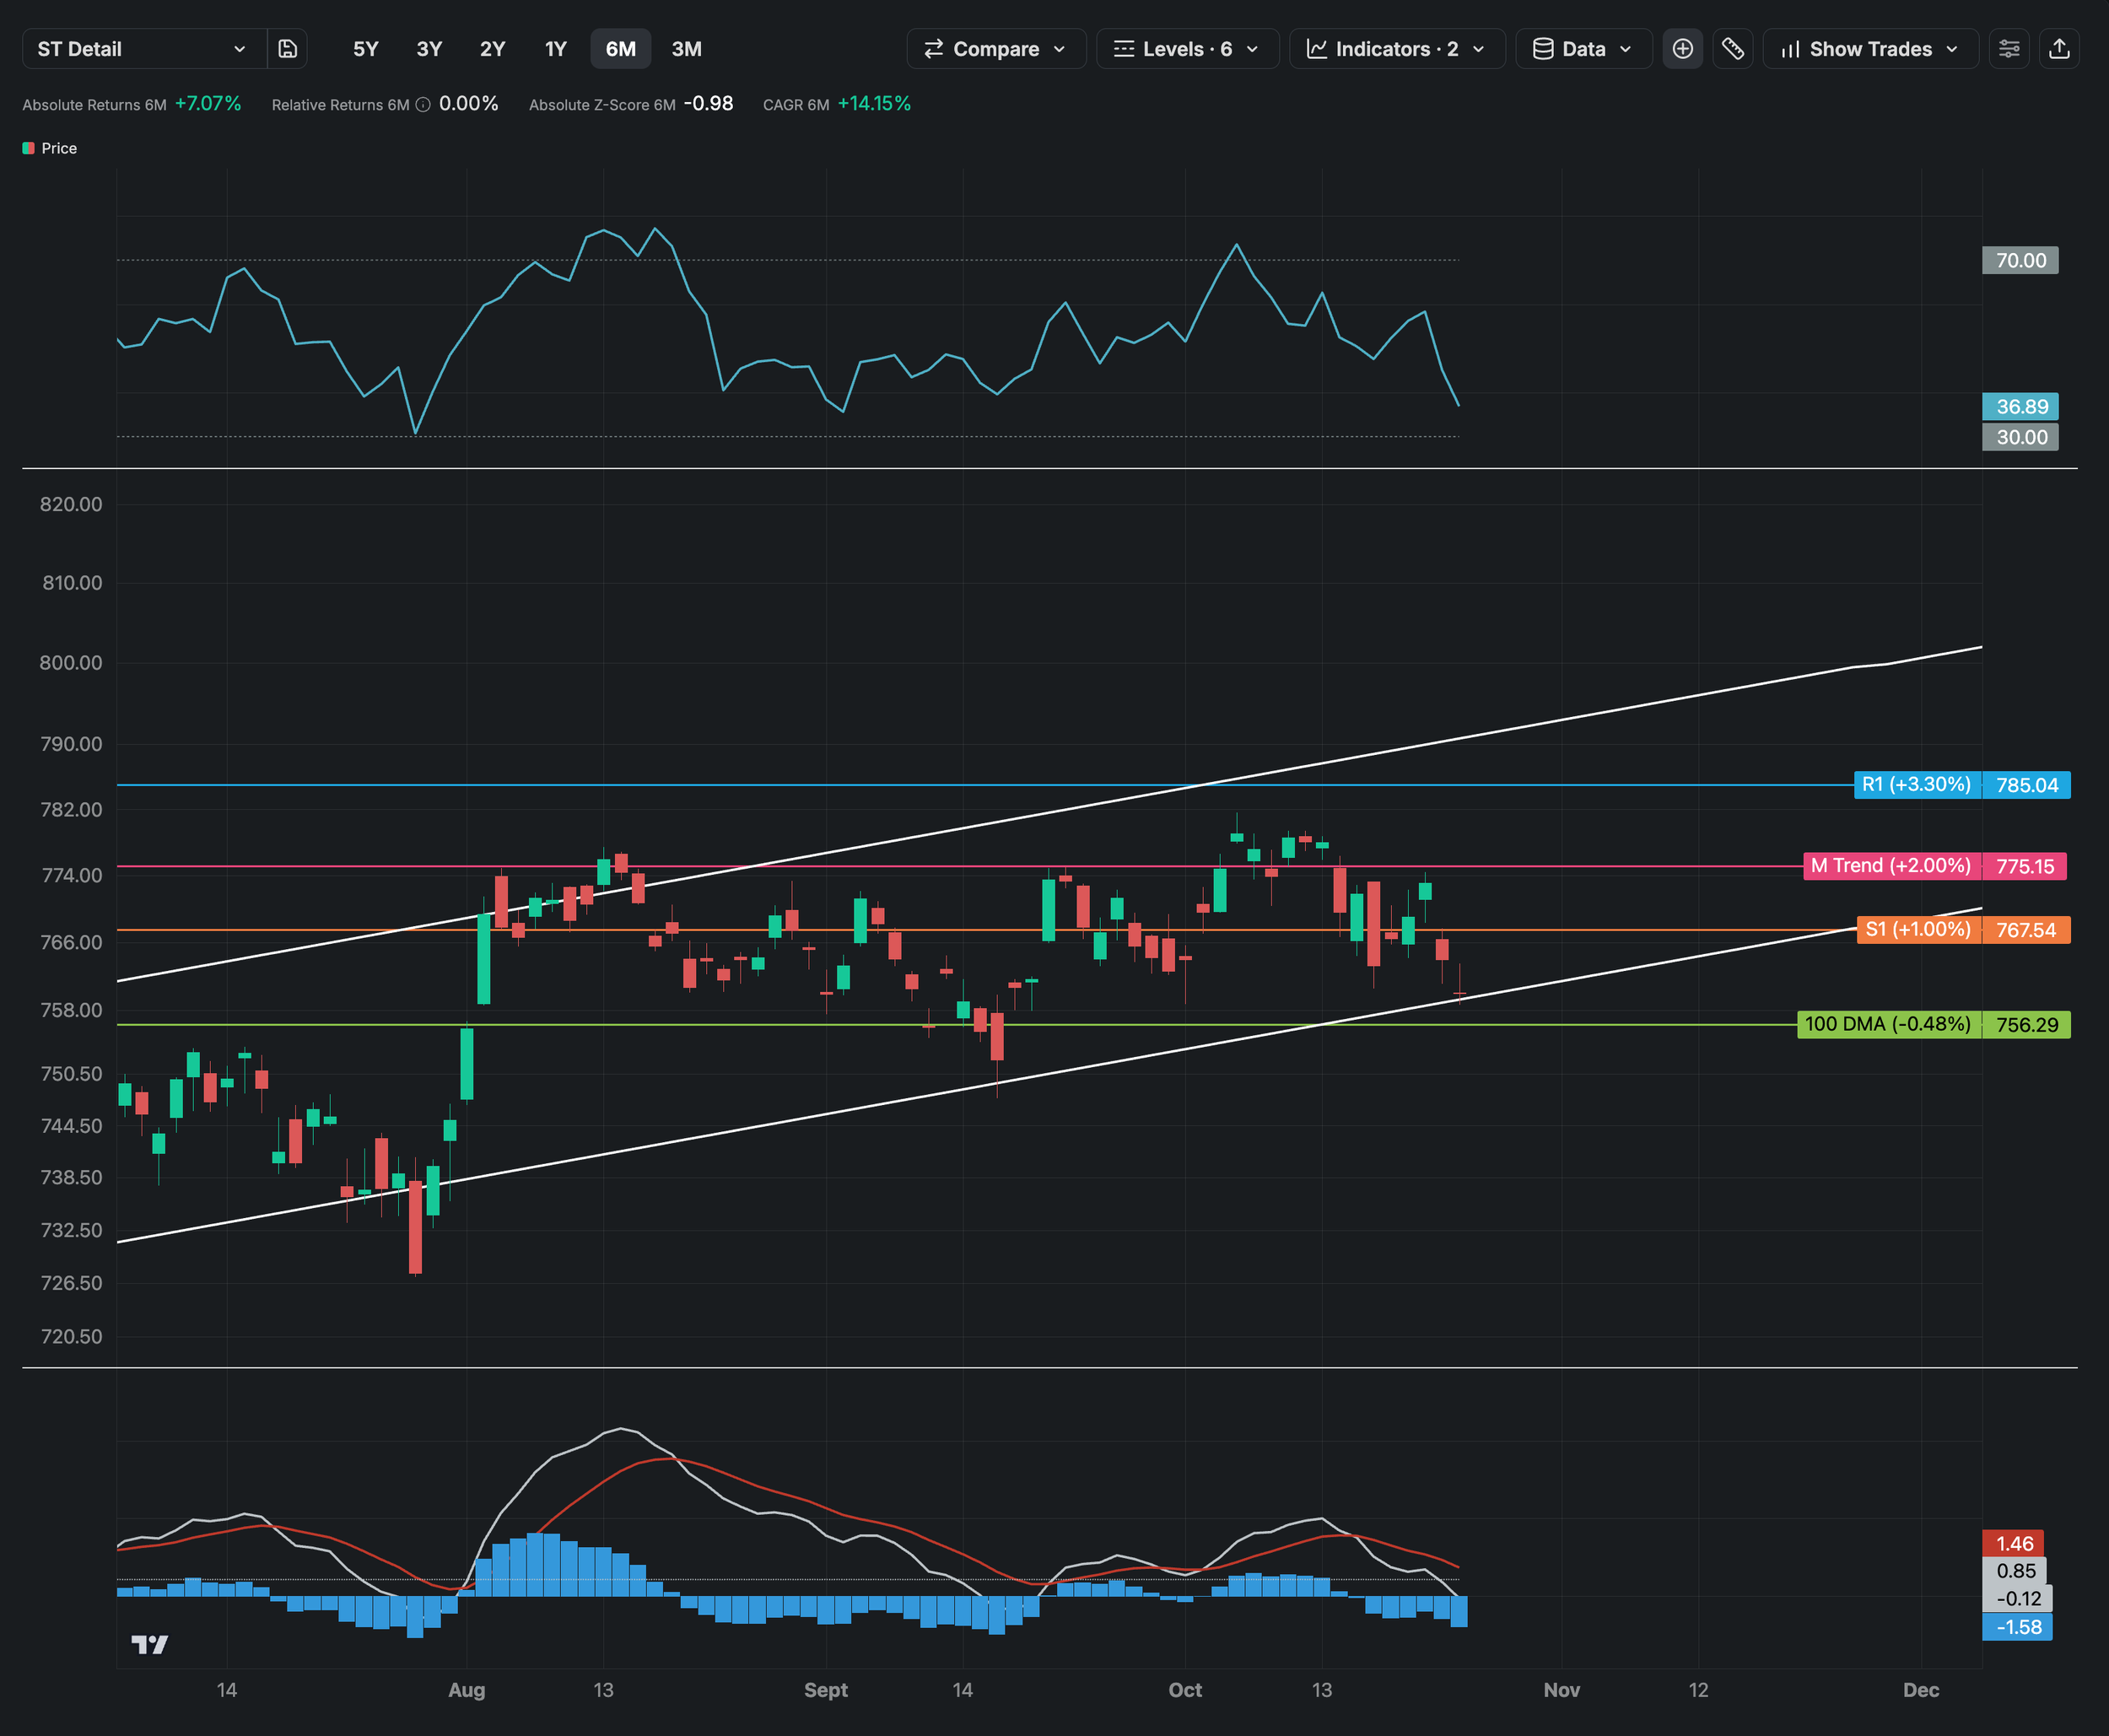
The technical backdrop remains constructive overall, though the outlook is cautious in the near term. SPY closed Friday down -0.43% for the week, below its 50-DMA by around -1%, and now sitting right on top of the key 100-DMA support at $756.
The longer term trends are intact, with the 200-DMA climbing and sitting well below the last close price. 3, 6, 12 and 24 month trading channels are all sloping up.
Friday’s close landed right on the lower 6-Month regression channel trendline. Closes below that line marked short-term lows in June, July and September this year. The test of support is here. If it fails, downside stands at $719, some -5.3% below. Upside is capped at $800-814 by year end (+7%, R1).
A decisive daily close back above the 20-DMA ($770.15) alongside a return to positive net GEX would reassert bullish momentum, while a breakdown below $756 would embolden the bears.
All the while, the Equally Weighted S&P 500 (RSP) has steadily outperformed. Since the start of October, RSP is up +4%, recouping a good part of the post summer decline. The average stock is holding up while the mega-caps drag the cap-weighted index lower.
Three weeks ago, only three sectors were outperforming the index. As of Friday, eight of the 12 sectors are ahead, based on their distance from their 50-day averages. Only technology, industrials, and communications are lagging. Energy is the most extended, followed by health care and staples. The leaders have turned into the crowded trade, while any bounce is more likely to come from the laggards.
Whenever the 2-year relative Z-Score (SPY / RSP) hits values above +1.59, the broadening move tends to conclude. We are nearly at that point currently, with the ratio reading +1.08 in standard deviation terms. As such, the rebalancing opportunity now favors the laggards (growth) rather than the leaders (value).
The real test for the market arrives this week. Roughly 44% of S&P 500 companies report earnings, including Microsoft and Alphabet on Wednesday and Amazon on Thursday, alongside a Fed decision and the September PCE report. That’s a heavy slate of information for a market already sitting on support.
If this support holds and mega-caps confirm AI spending is generating returns, oversold tech has the room to rally. The 3 most important data points arrive on Wednesday: the Fed decision, plus Microsoft and Alphabet earnings. Amazon follows Thursday evening.
Following Meta, it's no longer a question of whether companies are investing in AI but whether that spending is beginning to translate into cash (getting a concrete return on that investment). Visa and Mastercard offer a read into consumer behavior, while Exxon and Chevron report on Friday.
The Fed announces its decision Wednesday at 2:00 p.m. ET, followed by Chair Kevin Warsh’s press conference at 2:30. Markets widely expect the rate to stay in the 3.75%–4.00% range after September’s hike. Odds of a move have faded following Thursday’s bond rally. The real risk lies in the tone. A hawkish message from Warsh, with Brent crude at a six-month high, could send the 10-year yield back above 5%, which is what the tech sector doesn’t need.
Thursday brings the week’s heaviest economic data slate. Third-quarter GDP is expected near 3%, while the September PCE report is forecast to show headline inflation rising to 3.6% from 3.4%, with core inflation at 3.1%. Friday’s employment cost index will offer the clearest signal of whether inflation is feeding into wages.
We are closely watching the reaction of bonds at this stage, due to the sudden shift in the correlation between SPY and TLT (20 and 90 day correlation shown below). Suddenly, bonds have moved opposite to stocks, as the growth scare in AI has depressed yields in a flight to safety trade. The 90-day correlation is still positive but clearly on the decline since summer.
Below zero, bonds hedge stocks. Above zero, they fall with stocks.
It was the spike in oil which allowed the stocks-bonds correlation to run high this summer (energy shock → higher yields → lower stocks). Now that the correlation is flipping, the market’s message is different. It reads something like: higher oil prices will slow economic growth regardless of inflation, hence bonds get bid and yields fall back in order to reflect reduced growth. It is entirely possible we’ll see bonds continue to hedge stocks as we move into Q4 and the energy shock fades (oil prices can stay elevated on an absolute basis, it’s just a question of the direction in prices).
Speaking of hedging, the risk / reward calculus hasn’t really improved from last week, despite the headline index drop. This setup tells us there is no clear dip buying trade forming at a market-wide level.
Our Trading Strategy (Sigma Portfolio)
We’ll let the market dictate our next move, as we are now clearly sitting at a pivotal point. Both the upside and the downside for the equity market are substantial. Enterprise has not given us an “all clear” signal just yet, but we’ll be watching tomorrow’s rebalance.
In the event of a breakout (dovish Fed, cool inflation drivers, decent tech earnings), we’ll add to oversold Tech / Comms within our equity sleeve. Should the market move lower, it would be prudent to trigger some stops and raise more cash. The bond allocation is here to stay.
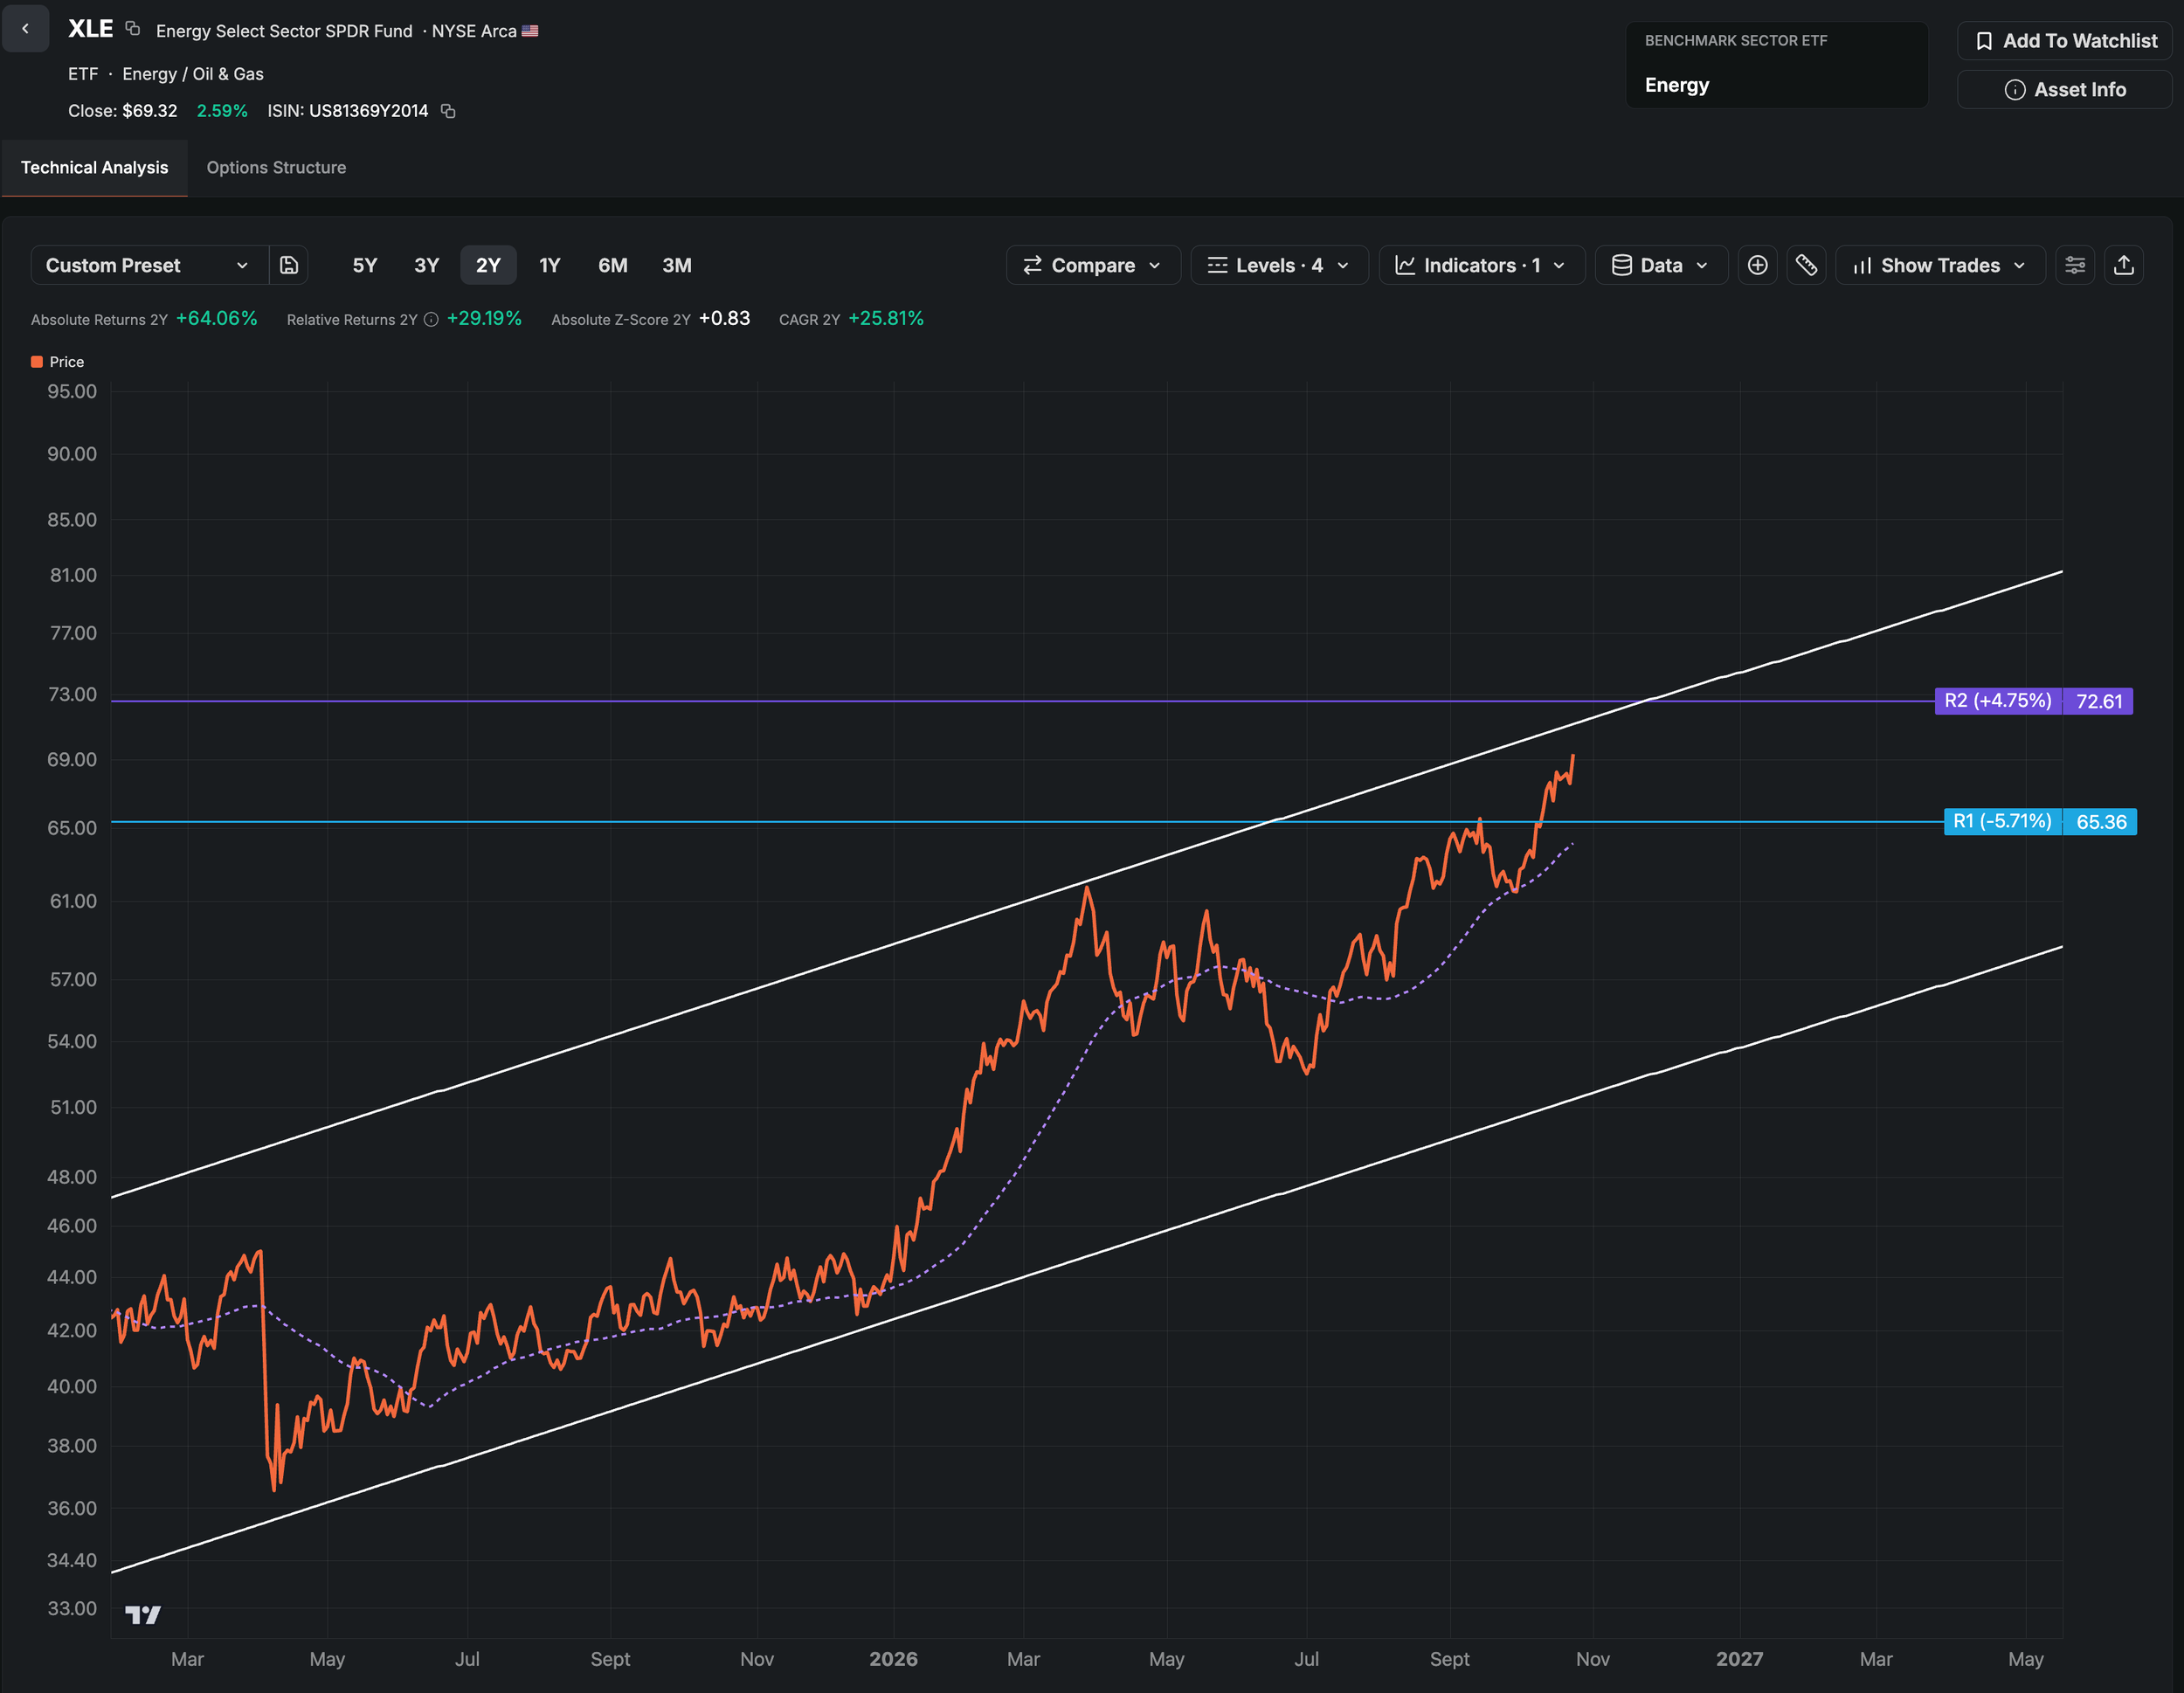
Exposure to commodities / energy can be trimmed due to the overbought nature of those trades. We’ll conclude this newsletter with the chart of Energy (XLE), which has nearly reached its technical long term limit.
Disclosures / Disclaimers: This is not a solicitation to buy, sell, or otherwise transact any stock or its derivatives. Nor should it be construed as an endorsement of any particular investment or opinion of the stock’s current or future price. To be clear, I do not encourage or recommend for anyone to follow my lead on this or any other stocks, since I may enter, exit, or reverse a position at any time without notice, regardless of the facts or perceived implications of this blog post. I currently do not own or plan to own any position, long or short, in the securities mentioned.
I am not a financial advisor licensed in the United States. Nor am I providing any recommendations, price targets, or opinions about valuation regarding the companies discussed herein. Any disclosures regarding my holdings are true as of the time this article is written, but subject to change without notice. I frequently trade my positions, often on an intraday basis. Thus, it is possible that I might be buying and/or selling the securities mentioned herein and/or its derivative at any time, regardless of (and possibly contrary to) the content of this blog post.
I undertake no responsibility to update my disclosures and they may therefore be inaccurate thereafter. Likewise, any opinions are as of the date of publication, and are subject to change without notice and may not be updated. I believe that the sources of information I use are accurate but there can be no assurance that they are. All investments carry the risk of loss and the securities mentioned herein may entail a high level of risk. Investors considering an investment should perform their own research and consult with a qualified investment professional.
I wrote this blog post myself, and it expresses my own opinions. I do not have a business relationship with any company whose stock is mentioned in this blog post. The information in this blog post is for informational purposes only and should not be regarded as investment advice or as a recommendation regarding any particular security or course of action.
The primary purpose of this blog post is to share industry expertise and research and receive feedback (confirmation / refutation) regarding my investment theses.