
Options Structure Now Available Via API
The options chain is not one number. It is a stack of contracts that expire on different days, and each of those days has its own walls, volume, and hedging profile. A single “SPY GEX” figure hides that. The new /api/options_structure endpoint is built to show it.
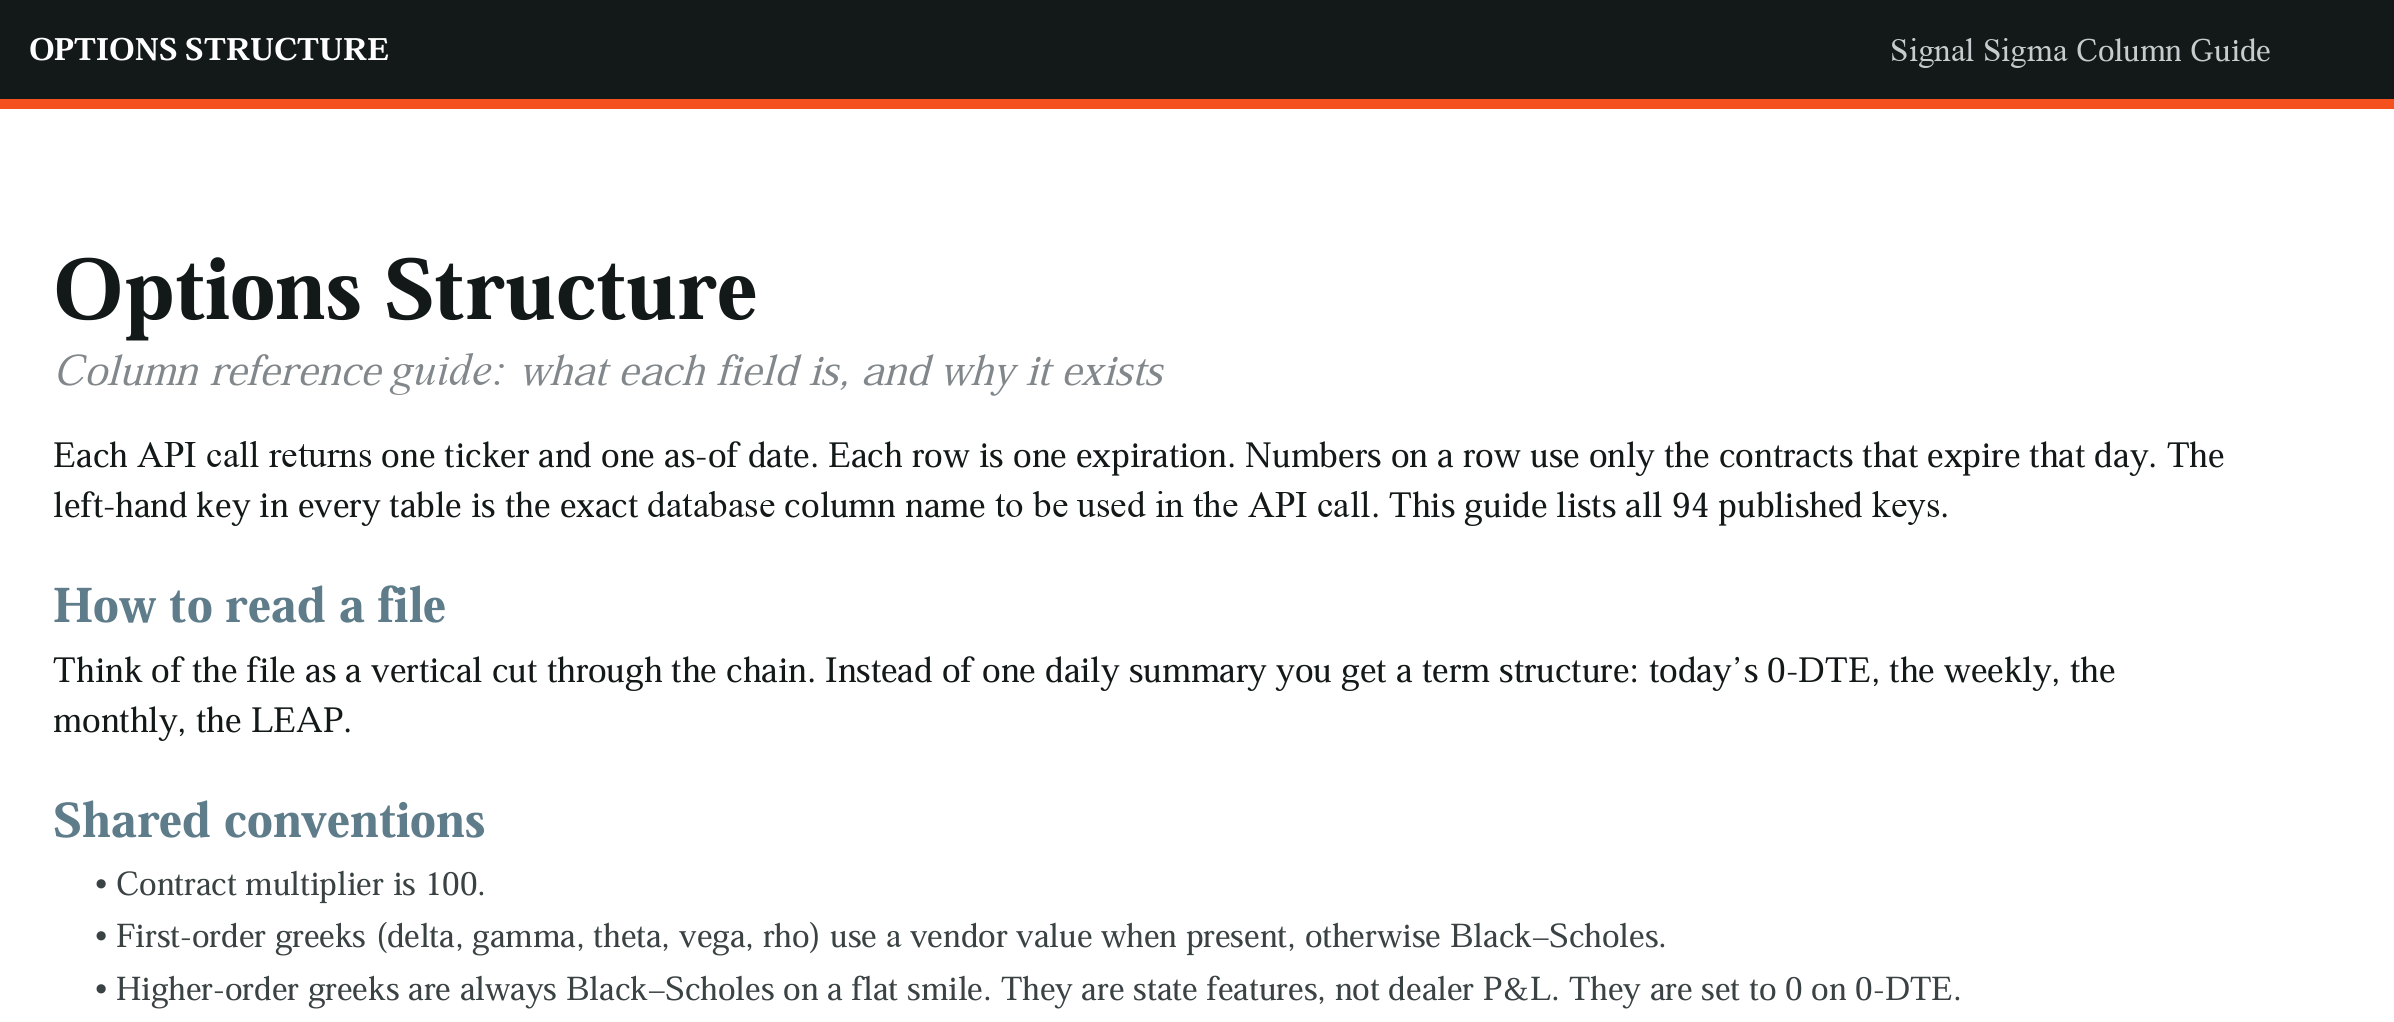
This data is available only through the API for now. It is available to both Research and Pro subscribers. You need an API key, the same Bearer header as the rest of the Signal Sigma API, and the key names from the Options Structure Column Guide here: https://www.signal-sigma.com/s/Options_Structure_API_Guide.pdf
You ask for a ticker, a metric, and optionally an as-of date. The API returns every expiry on that snapshot, always with expiry_date attached. Here’s an example of how the options chain for SPY looked like on 2026-09-29. Note the difference between as_of_date (2026-09-29) and the various contract expiration dates, with increasing days_to_expiration.
A single API request is a snapshot, not a time series. date (in the API call) maps to as_of_date (in the database): the day the chain was observed. Each row is one expiry_date. Spot, volume, walls, and greeks on that row use only that expiry. If you omit date, you get the latest snapshot for that ticker.
The length of the response varies with the length of the chain. SPY on a busy Monday can have a long list. A thinner single-stock name will not. Missing values come back as null. Do not average across expiries unless you also weight by volume or open interest (that’s how we do it in the AGGREGATED DATABASE, which this is not).
Before any ratio or greek, pull the three columns that locate the chain: spot, days_to_expiration, and is_zero_dte. Spot is the underlying close on the as-of date. Walls, distances, and dollar greeks scale off it. Days to expiration is calendar time left. Zero means they expire today.
A practical first pass:
Call spot and store that price.
Call days_to_expiration and split the chain into 0DTE, 1–7 days, 8–30 days, and beyond.
Call is_thin and down-weight or ignore thin expiries when you rank walls.
Call total_options_volume so a quiet expiry cannot dominate a the result.
That split is the whole point of the endpoint. Front-week SPY and a three-month SPY expiry can point in opposite directions on the same afternoon. If you only store one number per ticker per day, you have already thrown the signal away.
Put-call structure without a fake ratio
The file already carries bullish_volume, bearish_volume, and bullish_percentage. That is the cleanest put-call read this endpoint gives you, and it is already split by expiry.
bullish_percentage is the share of directional volume on the bullish side for that expiry. A value of 0.25 means about a quarter of that expiry’s directional volume was bullish. Pair it with the raw volumes so a tiny expiry cannot look as important as a huge one.
A useful derived ratio, computed on your side after two calls or after you have both series aligned on expiry_date:

On the 2023-01-03 SPY sample, the same-day expiry had bullish volume of 302,363 against bearish volume of 905,810, so bullish_percentage printed 0.2503. The next-day expiry was even more one-sided, at 0.0695. The 9-day expiry flipped the other way, at 0.7589, but it was flagged thin. That is the pattern you want to see in a table: which expiry is actually carrying the flow, and which one is noise.
Use it like this:
Rank expiries by total_options_volume.
Keep the top few, plus anything with is_zero_dte equal to 1.
Read bullish_percentage only on those rows.
Treat a low percentage in the front of the chain as defensive flow, not as a forecast.
Do not call this a classic exchange put-call ratio. It is expiry-level directional volume from this structure file. If you want a book-level number, volume-weight the expiry readings yourself. The API will not do that blend for you, on purpose.
Walls, and the distance that matters
put_wall and call_wall are the levels. They are not targets. They are the strikes where positioning is concentrated for that expiry. A call wall usually sits above spot. A put wall usually sits below it. Price can and does trade through both.
Pull both metrics, then join them to spot on expiry_date. Distance is the useful feature:
On the sample snapshot, SPY spot was 380.82. The same-day call wall was 390.63, about 2.6% above. The same-day put wall was 369.02, about 3.1% below. The 17-day expiry had a lower put wall, 364.30, and a higher call wall, 400.04. The range widens as you go out. That is normal. A tight front-week range with heavy volume is a different trade from a wide monthly range with light volume.
Three uses that hold up:
Context for a mean-reversion book. A high distance to the call wall, in a liquid expiry, is effective headroom. A price already sitting on the call wall has nowhere to run, in contrast.
Context for a trend book. Repeated closes through a front-week call wall, with bullish_percentage rising in the next expiries, is expansion. The wall did not “fail.” The hedging inventory moved.
Expiry selection. If the 0DTE wall is close and the 30-day wall is far, you are looking at a session-level pin.
Greeks
Delta tells you how much hedge the book wants at the current spot. Gamma tells you how fast that hedge changes when spot moves. Theta is the carry of time. Vega is the sensitivity to implied volatility. Those are the session tools. Gamma and delta matter most when days_to_expiration is small and is_zero_dte is 1, because the same notional then forces more hedging per point of price.
A workable gamma pass:
Request the gamma column for SPY, QQQ, and IWM on the same as_of_date.
Join each result to days_to_expiration and total_options_volume.
Keep expiries inside 7 days with real volume.
Note the sign and the location relative to spot, put_wall, and call_wall.
Positive gamma near spot tends to damp moves: dealers buy dips and sell rips to stay flat. Negative gamma near spot tends to amplify them: the hedge is in the same direction as the move. This is a positioning description, not a forecast. It fails when the book is thin, or when the price moving event is larger than the hedge.
Vega belongs further out the curve. A large vega reading in a 2-day expiry is a different risk from the same reading in a 90-day expiry. Always store days_to_expiration beside it. Theta is the mirror image of that calendar: short-dated short-premium books earn it fastest and lose it fastest when the underlying gaps.
Higher-order greeks: vanna and charm
Vanna and charm are why a quiet gamma reading can still move the open.
Vanna is how delta changes when implied volatility changes. Charm is how delta changes as time passes, even if price does not. Neither replaces the walls. They explain the hedge that shows up when price is flat.
Use them on event days and into expiration, not necessarily as a signal:
Vanna, into a known volatility event. CPI, FOMC, and earnings change implied vol before they change the close. If front-expiry vanna is large and the put side dominates, a vol spike can force selling even while spot has not broken the put wall. If vol is crushing after the event, the same book can force buying. Check the 0DTE and the next two expiries first. A LEAP vanna number will not explain the next day, of course.
Charm, into the close of expiry week. Charm accumulates as the clock runs. On a Friday with is_zero_dte equal to 1, charm can be the flow even when the walls have not moved. Compare the 0DTE charm reading with the next weekly. If only the expiring line is large, it is a session effect. If the next weekly is large too, it can spill into Monday.
Cross-check with walls. A call wall 1% above spot plus large negative front-expiry gamma is a different setup from the same wall with large vanna and flat gamma. The first is a price-path hedge. The second is a volatility-path hedge. Remember the difference.
The workflow is the same as with walls. Pull the greek. Pull spot, days_to_expiration, is_thin, and total_options_volume. Drop thin rows if you wish. Do not blend 0DTE with a quarterly expiration without weighting.
Four workflow examples:
1. Cross-index disagreement. Run the same metric set analysis on various key ETFs like SPY, QQQ, and IWM. If QQQ front-week bullish_percentage is high and SPY’s is low, the index story is not the same story. Sector and single-name work should know which book is actually bid.
2. Single-name event sheet. For a stock, pull the weekly expiry around earnings. Compare put_wall, call_wall, and the relevant greek columns to spot.
3. History, built by you. This endpoint returns one as-of date per call. To study how the 7-day put wall migrated into a selloff, loop dates and store as_of_date, expiry_date, and the metric. Try to generate a signal from the change you observe in the metrics.
4. Treat data as a filter in a backtesting system. A rule such as “only buy the ETF whose liquid call wall is furthest above spot 15 days out” is testable. This endpoint gives you the input. Join the levels to your own price history from /api/price_history if you want to see what happened next.
We hope this short guide and the new dataset help you in navigating the markets and making sense of key risks and opportunities ahead. We will soon display these in the app itself, as we develop a frontend display for individual tickers. Eventually, part of these metrics will make it in the regular aggregated database (the one accessible in Watchlists, Screeners, etc.), so that rapid comparison between tickers can be done. The aggregated metrics will also be available via our own backtesting service.
Until then, building on top of this data is up to you!
As always,
Happy Investing
Andrei Sota & Signal Sigma Team