/ May 11 / Weekly Preview
-
Monday:
N/A
---
Tuesday:
Core Inflation Rate YoY (2.7% exp.)
Inflation Rate YoY (3.7% exp.)
---
Wednesday:
PPI MoM (0.5% exp.)
---
Thursday:
Retail Sales MoM
Initial Jobless Claims (205K exp.)
---
Friday:
N/A
-
Monday:
N/A
---
Tuesday:
N/A
---
Wednesday:
Cisco Systems, Inc.
Alibaba Group Holding Limited
---
Thursday:
Applied Materials, Inc.
Toyota Motor Corp Ltd Ord
---
Friday:
RLX Technology Inc.
A Rotation In The Making
Got a question about the markets, your investments, or a topic you’d like us to discuss in an upcoming article? We read every message and may feature your question in our daily write-ups!
Email: andrei@signal-sigma.com
Follow & DM on X: @signal_sigma
Last week, major averages closed at fresh all time highs, with the S&P 500 adding +1.4% to finish near 7,330. The main drivers of the advance were Communications (XLC), Energy (XLE), Tech (XLK) and Consumer Discretionary (XLY), while sectors like Basic Materials (XLB), Industrials (XLI) and Healthcare (XLV) lagged.
Geopolitical risk became background noise at this point, as earnings take center stage. Earnings are always the bottom line when it comes to the market trend.
On Monday, Palantir posted a standout earnings report, with revenue surging 85% year-over-year to $1.63 billion—beating estimates and marking its fastest growth since going public in 2020—while adjusted EPS of $0.33 topped the $0.28 consensus. The company raised its full-year guidance to $7.65–$7.66 billion, implying 71% growth, and highlighted explosive U.S. commercial revenue growth of 133% alongside 84% government revenue growth, driving its Rule of 40 score to 145%, a level matched only by Nvidia, Micron, and SK Hynix.
On Tuesday, AMD followed with solid results, reporting adjusted EPS of $1.37 and revenue of $10.25 billion (both beating estimates), fueled by 57% data center growth, with CEO Lisa Su expressing strong confidence in reaching tens of billions in AI revenue next year—sending the stock up 16%.
Together with Alphabet’s prior report, these results confirm the AI infrastructure buildout is not slowing and earnings leverage is just beginning to scale. Broader S&P 500 earnings season remains robust, with 84% of the 63% of companies that have reported beating estimates by an aggregate 20.7%, and analysts now projecting 19.7% EPS growth for 2026 (up from 14% in 2025) amid an atypical pattern of upward revisions (FactSet).
Technically speaking, a pullback is the most likely path forward in the next period. While SPY has reached an all-time high value on Friday, a critical divergence is starting to form. Friday’s Nasdaq surged 1.71% while the Dow gained just 0.02%. the Equally Weighted S&P 500 (RSP) was up only 0.28% and has not yet reached an ATH value.
On a relative scale (RSP vs SPY, charted below), we’re looking at a near vertical drop in performance of the equal weighted index versus the cap weighted one. Up-moves on this chart align with period of corrections in tech and AI-related names, while down-moves signal rallies in SPY.
This happens because outsized gains in the cap weighted index are driven by a minority of stocks - 30 or so semiconductor, tech and AI related names. Whenever this subgroup performs well, the entire index does well. Whenever there’s a correction, the “rest 470 stocks” outperform simply because they correct less during drawdowns.
Over the past 6 months, the difference between the “rest 470 stocks” and a leading semiconductor ETF (SMH, a good proxy for the 30 outperforming stocks) is staggering.
SPY without the AI component would have returned around 3.4% year-to-date. Over the same period, SMH is up +51%. Not only this divergence almost unprecedented, it is bound to end in only one way — a nasty mean reversion.
However, before we get to that mean reversion event, we would argue that the market will do even more chasing of momentum stocks. The chart below displays the current rally in leading sectors versus their largest through-to-peak moves over the past 5 years (max rallies).
SMH stands at about half it’s max rally. Tech (XLK) is also past the halfway mark. We would be inclined to take profits in the sector whenever either the RSP / SPY differential hits extremes or when the Current Rally / Max Rally ratio goes above 70%.
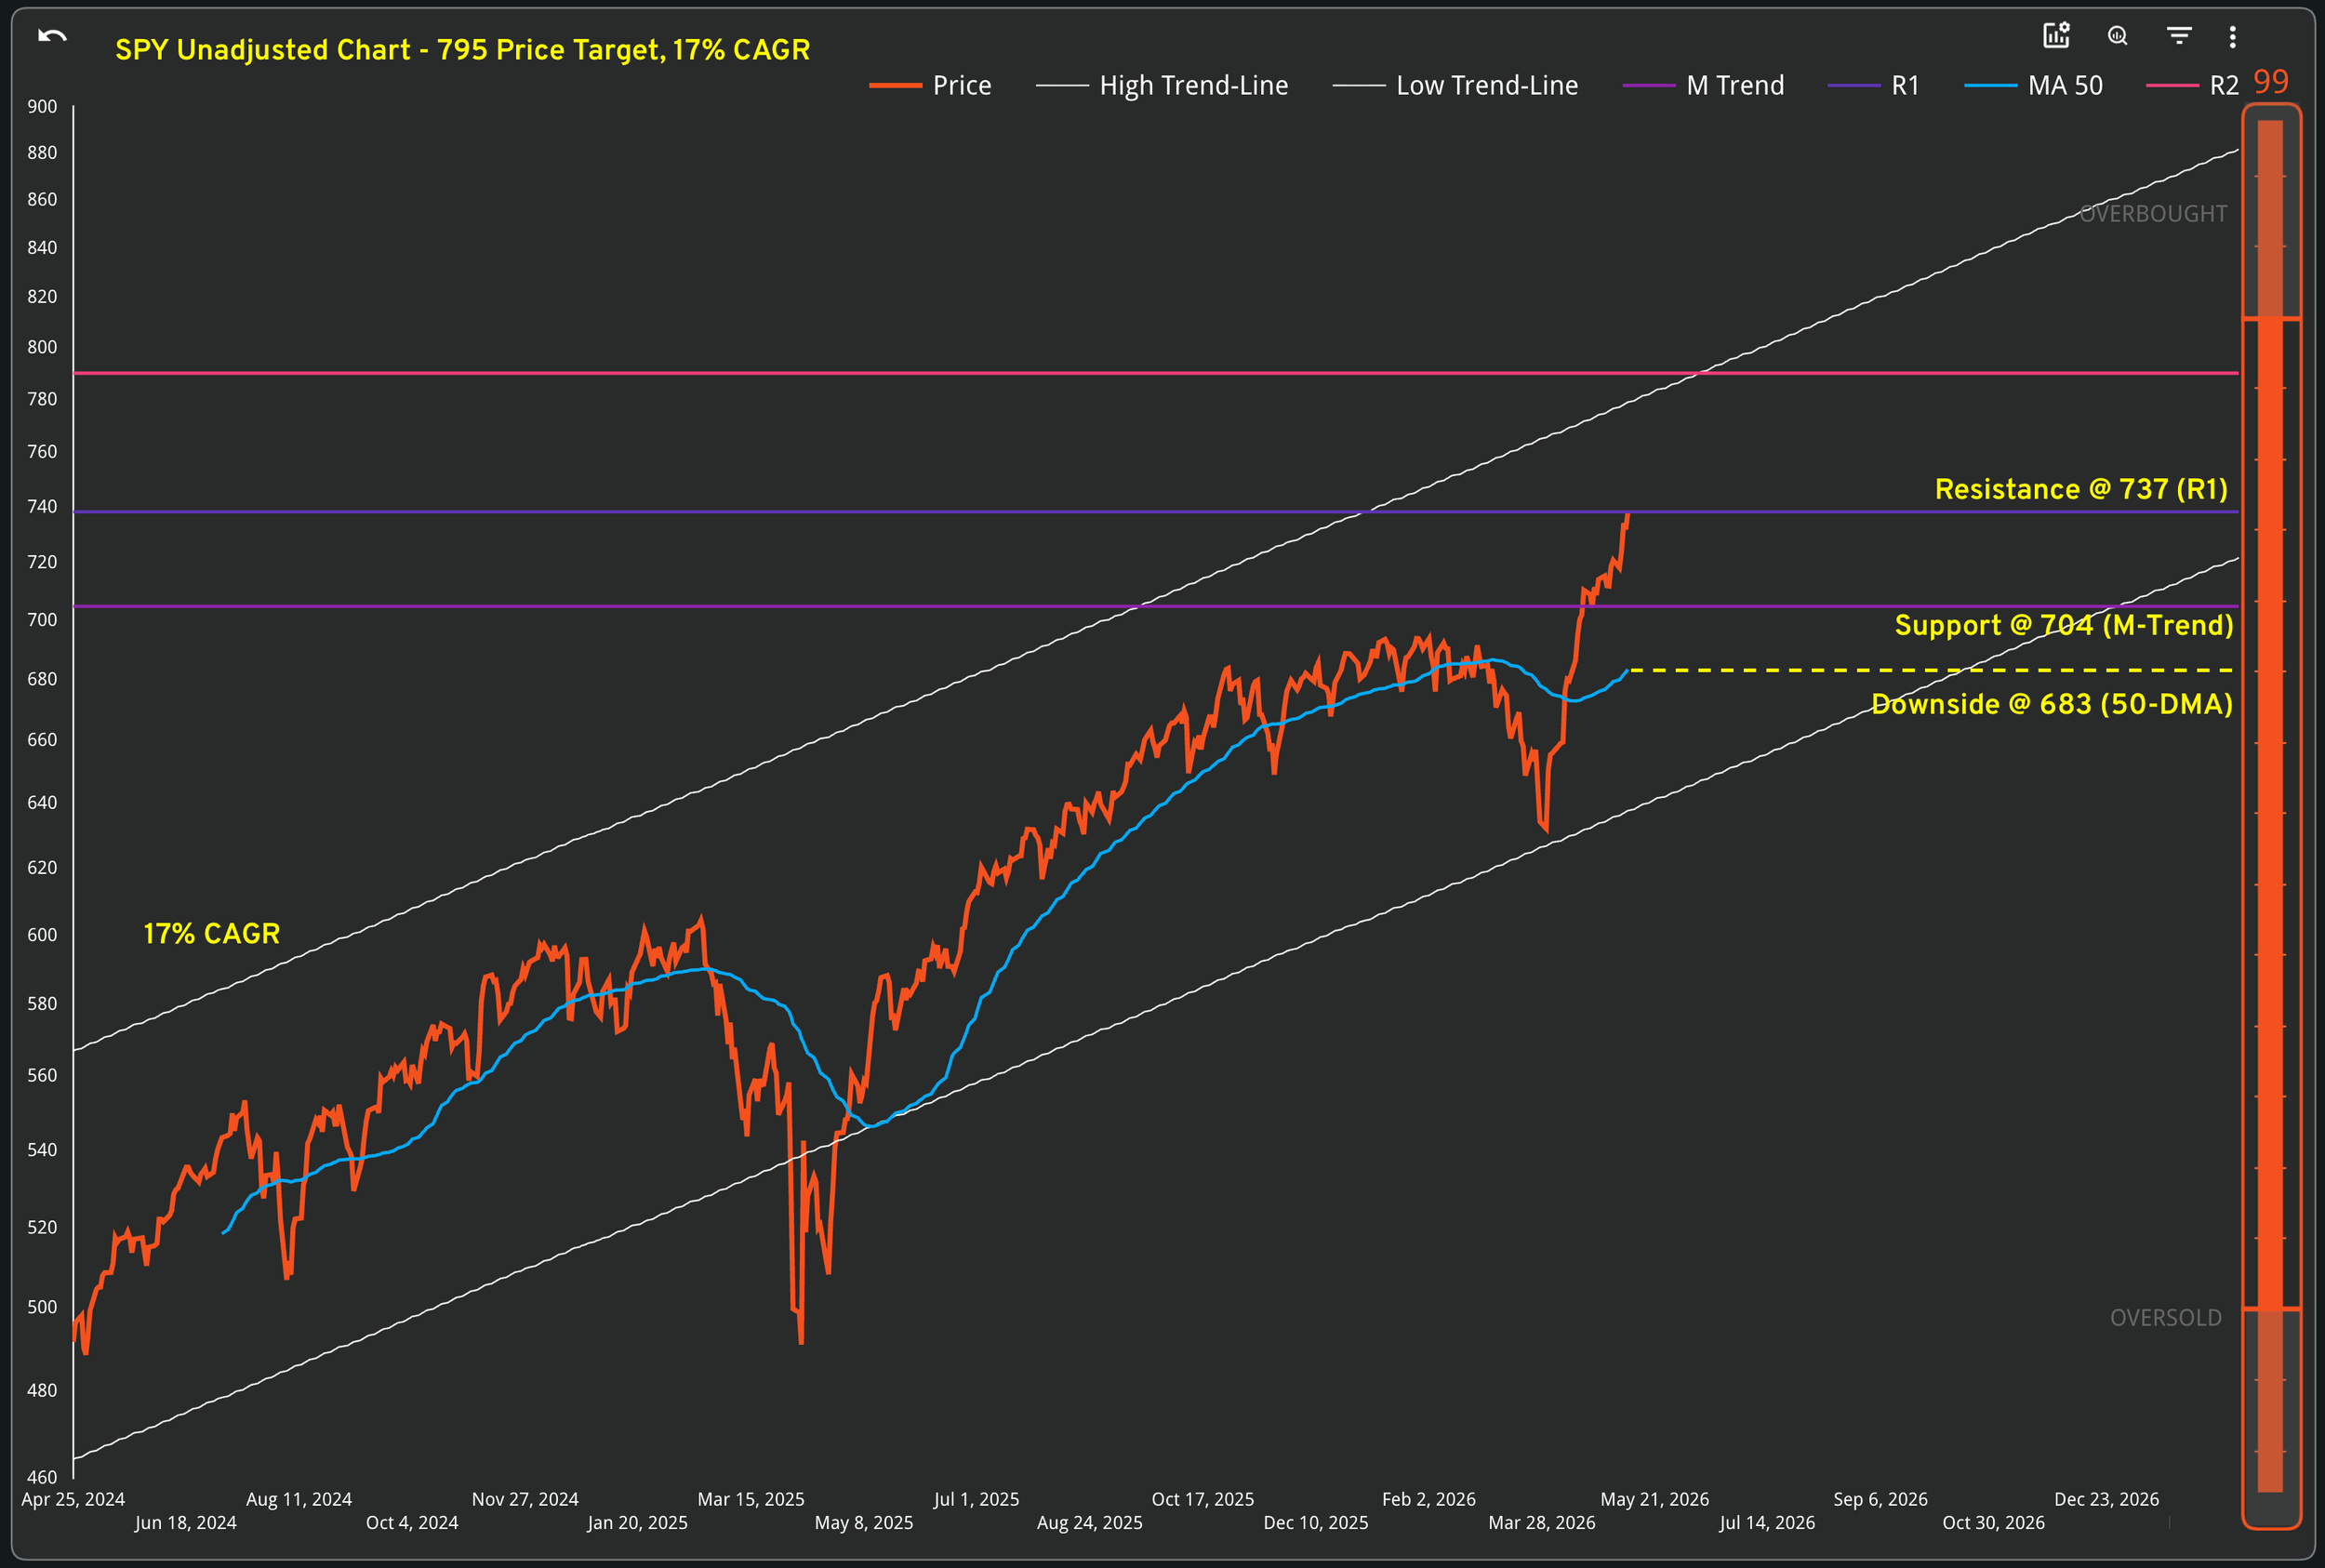
From a chart perspective, SPY has also hit a “wall” in the form of the R1 resistance level at $737. An advance to the next resistance level, around $789 in early summer would be plausible but truly parabolic in nature. That would also constitute a signal to rotate out of tech and AI and into more defensive names.
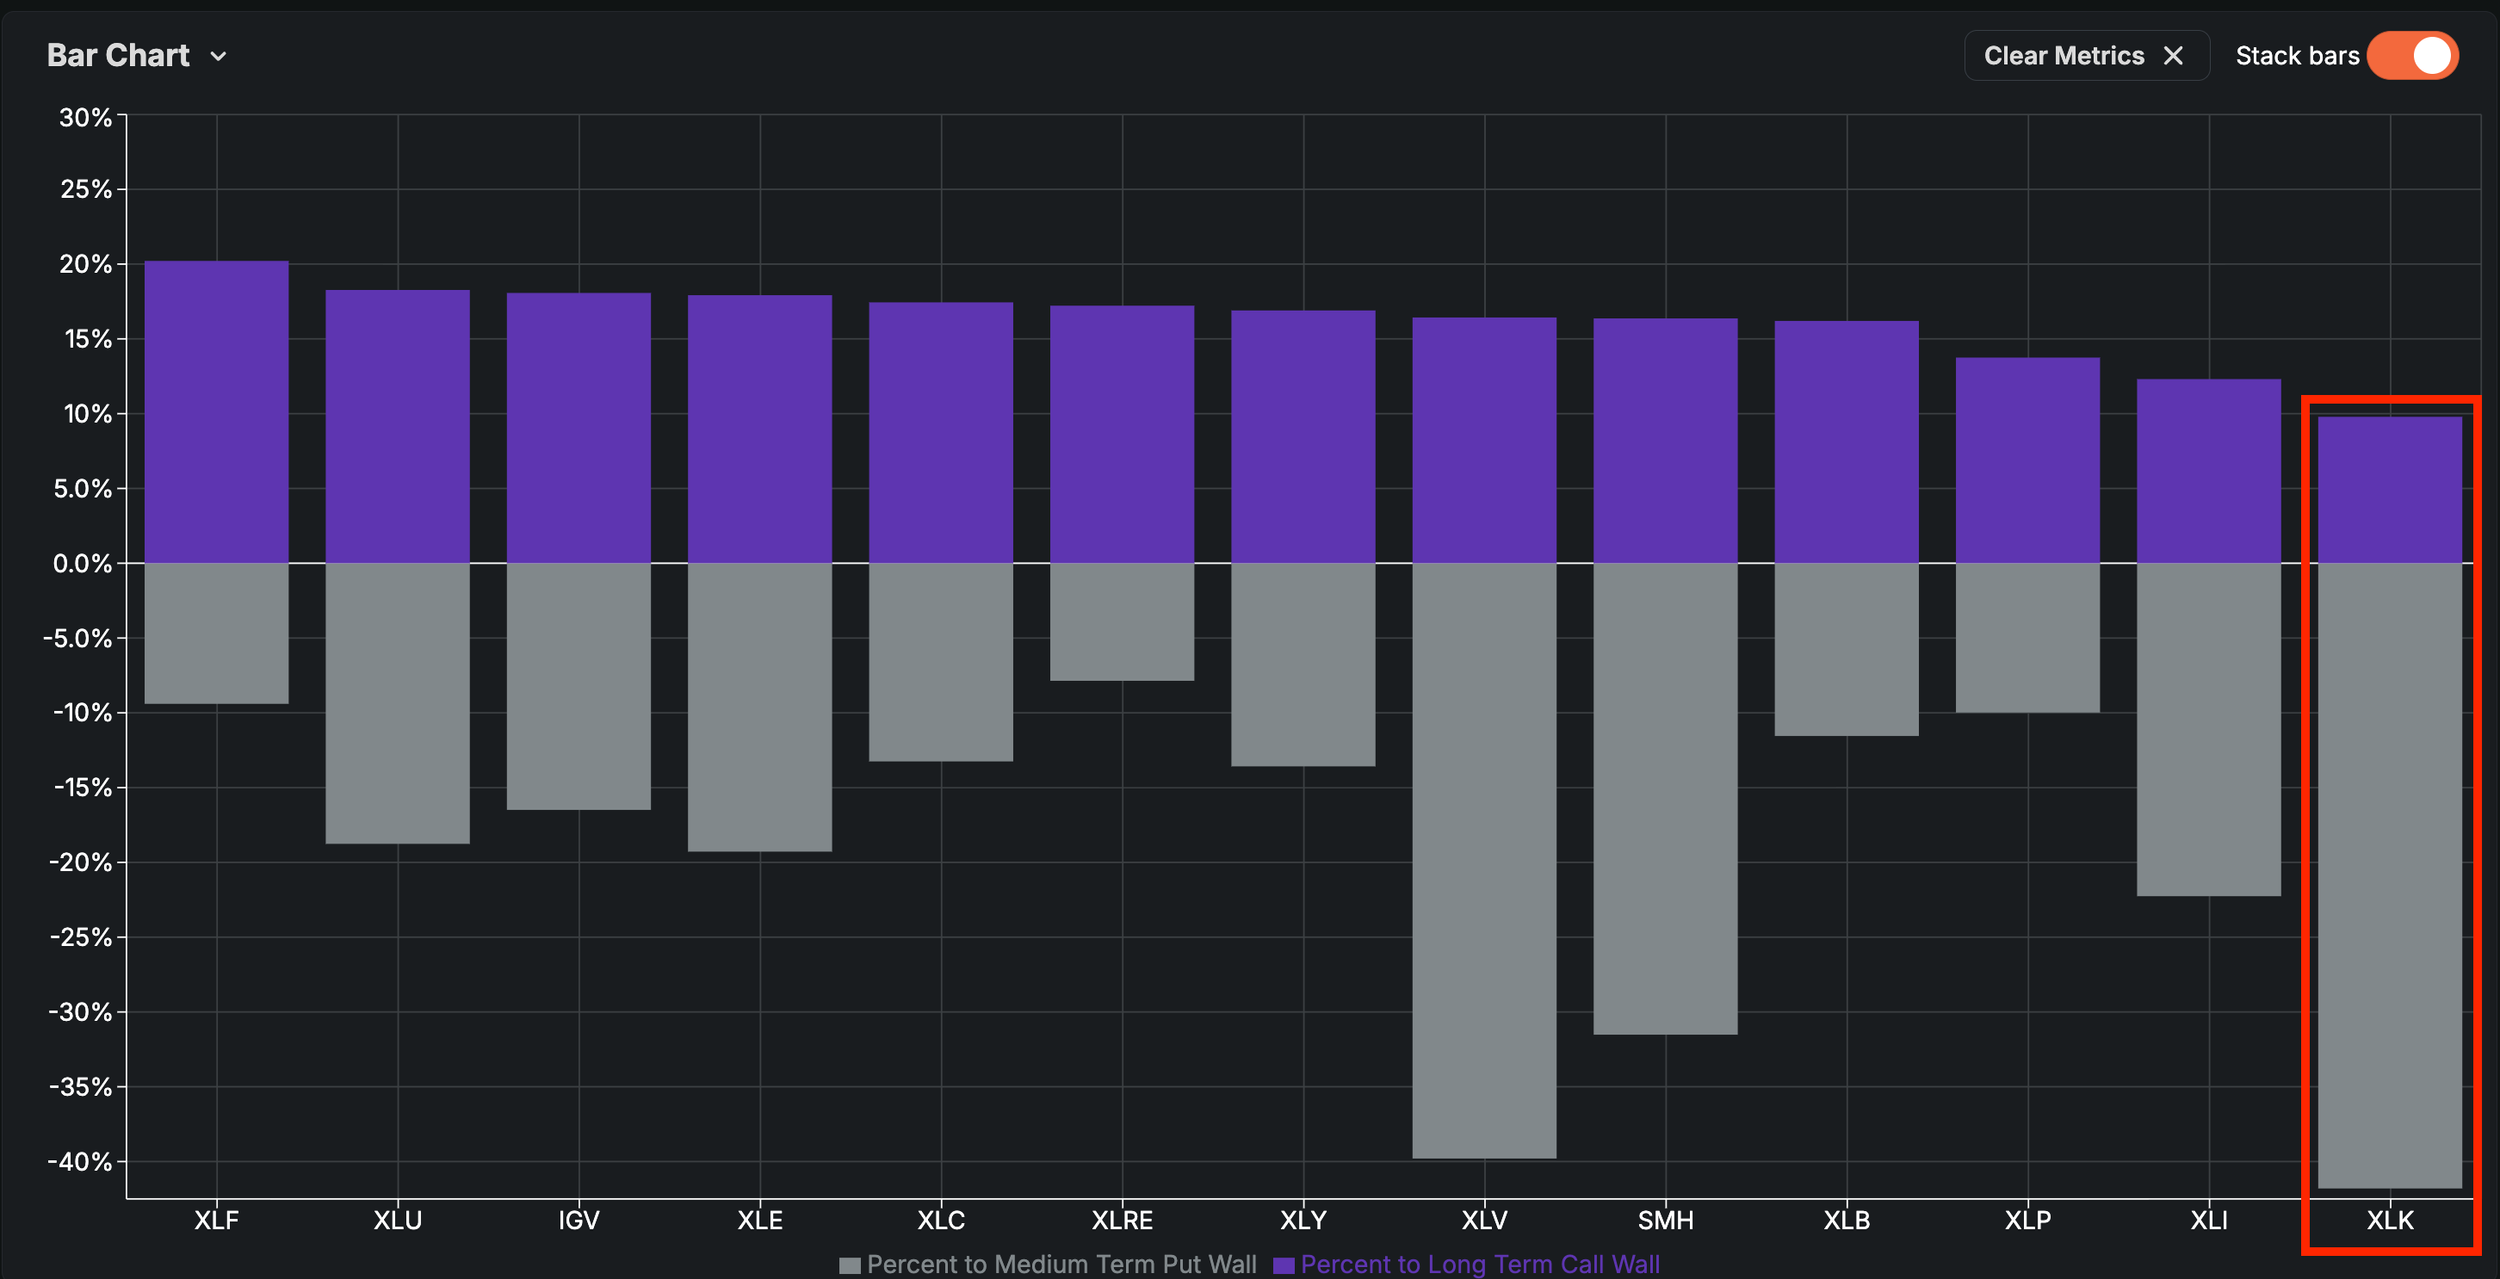
The most likely scenario at this juncture would be a rotation, and not an outright correction, as far as the S&P 500 is concerned. The options market is telling us that Tech (XLK) has the least long term upside (+9%) compared to medium term downside (-41%). This is a rug-pull in the making.
We would expect sectors with a far better risk-reward proposition to catch rotation flows: Financials (XLF), Real Estate (XLRE), Staples (XLP) and Basic Materials (XLB).
In any normal year, analysts begin the period overly optimistic and quietly walk estimates lower for the next six months by the time Q1 earnings season arrives, with the median drifting from an index of 1.00 in January to roughly 0.92 by year-end in a classic two-year reset.
This year has done the opposite: the 2026 index cratered to 0.96 last summer amid the tariff shock before turning sharply higher and breaking above 1.06 by May—a roughly 14-point swing relative to history that is “fairly unprecedented” according to Morgan Stanley.
Much of the surge is being driven by the Magnificent 7, whose expected growth rate has exploded from 22.4% at the end of March to a blended 61% today, with Alphabet, NVIDIA, Amazon, and Meta accounting for four of the top five contributors to S&P 500 earnings growth this quarter. These are the same names powering both the revisions and the broader index performance.
On a market-wide level we have not yet registered any clear sell signal. The advance has been narrow, but based on an exceptional Q1 earnings season. In other words, we’re in a bullish regime where fundamentals support the technicals, as the AI capex cycle is finally showing up in the income statement.
Our Trading Strategy (Sigma Portfolio)
This week, after the Magnificent 7 earnings and payrolls data, market focus pivots sharply back to a macroeconomic gauntlet that will shape the Federal Reserve’s path into the June FOMC meeting.
Tuesday’s April CPI, Wednesday’s April PPI, and Thursday’s April Retail Sales form a decisive three-day inflation-and-consumer trifecta that will either reinforce or shatter the “higher for longer” narrative. April CPI stands as the week’s centerpiece, testing whether March’s hot prints—fueled by the Iranian oil shock and broadened tariffs—were a one-off spike or the start of a lasting trend, with energy prices offering modest relief but core goods, used cars, and stubborn shelter costs continuing to pressure the numbers. A hotter-than-expected reading would effectively kill summer rate-cut hopes.
Wednesday’s PPI then doubles down by showing whether upstream producer prices, which surged in March, remain pressurized or have eased, revealing if costs are being absorbed into squeezed margins or passed through to keep consumer inflation elevated—either outcome carries negative implications for someone.
Meanwhile, a handful of earnings reports bridge the gap to Nvidia’s upcoming event: Cisco signals the health of enterprise IT capex and AI-driven demand, Alibaba delivers a China read on cloud, AI, and tariff-hit commerce, and Applied Materials offers an early semiconductor equipment indicator for chip capacity expansion.
In the end, CPI tells where inflation stands today, PPI hints at where it heads next, and Retail Sales reveals whether the consumer cracks first; if all three run hot, the “higher for longer” stance could harden into “higher for the foreseeable future,” forcing risk assets to reprice.
As the market hits more extreme deviations in the key Tech - AI - Semiconductor complex, we’re getting ready to take profits and rotate capital away from these areas which have fully priced in the entire 2026 earnings story.
Disclosures / Disclaimers: This is not a solicitation to buy, sell, or otherwise transact any stock or its derivatives. Nor should it be construed as an endorsement of any particular investment or opinion of the stock’s current or future price. To be clear, I do not encourage or recommend for anyone to follow my lead on this or any other stocks, since I may enter, exit, or reverse a position at any time without notice, regardless of the facts or perceived implications of this blog post. I currently do not own or plan to own any position, long or short, in the securities mentioned.
I am not a financial advisor licensed in the United States. Nor am I providing any recommendations, price targets, or opinions about valuation regarding the companies discussed herein. Any disclosures regarding my holdings are true as of the time this article is written, but subject to change without notice. I frequently trade my positions, often on an intraday basis. Thus, it is possible that I might be buying and/or selling the securities mentioned herein and/or its derivative at any time, regardless of (and possibly contrary to) the content of this blog post.
I undertake no responsibility to update my disclosures and they may therefore be inaccurate thereafter. Likewise, any opinions are as of the date of publication, and are subject to change without notice and may not be updated. I believe that the sources of information I use are accurate but there can be no assurance that they are. All investments carry the risk of loss and the securities mentioned herein may entail a high level of risk. Investors considering an investment should perform their own research and consult with a qualified investment professional.
I wrote this blog post myself, and it expresses my own opinions. I do not have a business relationship with any company whose stock is mentioned in this blog post. The information in this blog post is for informational purposes only and should not be regarded as investment advice or as a recommendation regarding any particular security or course of action.
The primary purpose of this blog post is to share industry expertise and research and receive feedback (confirmation / refutation) regarding my investment theses.