
-
This section has been moved to the Market Updates / Events Calendar tab
-
This section has been moved to the Market Updates / Earnings Calendar tab
Nvidia Cracks, Market Holds Steady
Got a question about the markets, your investments, or a topic you’d like us to discuss in an upcoming article? We read every message and may feature your question in our daily write-ups!
Email: andrei@signal-sigma.com
Follow & DM on X: @signal_sigma
Last week, the world’s most important chipmaker lost its CEO and founder, yet the S&P 500 still managed to rebound +2.5%. The Nasdaq also added +2.3%, and even the VanEck Semiconductor ETF rose +4.91% despite NVDA’s -12.75% drop. With the previous week’s losses, NVDA shareholders are now sitting on a -32% decline since the October 06 record.
Jensen Huang resigned as CEO, president, and board member, effective immediately, after an independent board investigation into his personal conduct. CFO Colette Kress has been named interim CEO. Harvey Jones, the board’s first-ever chair, is leading the search for a permanent successor. The company did not have any succession plan nor a COO in place. Shares became wildly volatile, opening -13% lower and rallying to close just -4% down on the news. The market is struggling to price in a “key man risk” that now threatens the outlook for an entire sector.
Regardless, all sector ETFs gained for the week.
Weekly Sector Returns
Stress in the AI funding complex deepened. SoftBank disclosed a ¥1.1 trillion quarterly loss (about $7 billion USD), while its five-year credit default swaps widened to roughly 500 basis points, the highest level since October 2022. At the same time, OpenAI delayed its equity offering until 2027, postponing a liquidity event SoftBank had been banking on.
CoreWeave still surged more than 20% on news of a $132.5 billion backlog, even though the company is carrying nearly $47 billion in debt. The market is now filtering between AI businesses that can fund themselves and those that must keep borrowing to grow.
Nvidia’s drama may have grabbed the headlines, but the macro backdrop offered the Fed little wiggle room. October CPI rose 0.4% on the month, and core inflation climbed a stronger-than-expected 0.3%. Fed Governor Waller went further, saying a half-point rate hike “should be considered” in December.
Friday’s PPI report offered little relief. The 0.3% monthly rise pushed the year-over-year rate to 6.5%, the fastest pace since November 2022. Rates responded accordingly: the 10-year yield jumped 29 basis points to 5.15%, the dollar index advanced 1.1% along with rising yields.
Existing-home sales dropped to a 3.75 million annual rate (the weakest since August 2010) showing that higher mortgage rates are biting.
NVDA remains a focal point this week, as it carries one of the largest weights in the S&P 500 and sits at the center of the capital-spending wave that has driven this year’s earnings growth. The company reports earnings on Tuesday after the close, but the quarterly numbers will not matter as much.
Elsewhere, Bitcoin fell 9.8% to below $70,000, gold dropped 4.9%, and the VIX settled at 19.35 from 25.64.
The RSP / SPY ratio remains highly elevated (more than 2 standard deviations above the mean), suggesting the “flight to safety” rotation is nearing its limits. Extremes on this study offer compelling entry points into the counter trade, favoring the cap weighted index to the equal weighted index.
The key thread into next week is straightforward. Nvidia’s Tuesday earnings now come with a leadership question attached to the numbers. At the same time, the case for a December Fed hike is all but settled. The only remaining question is whether the increase will be 25 or 50 basis points.
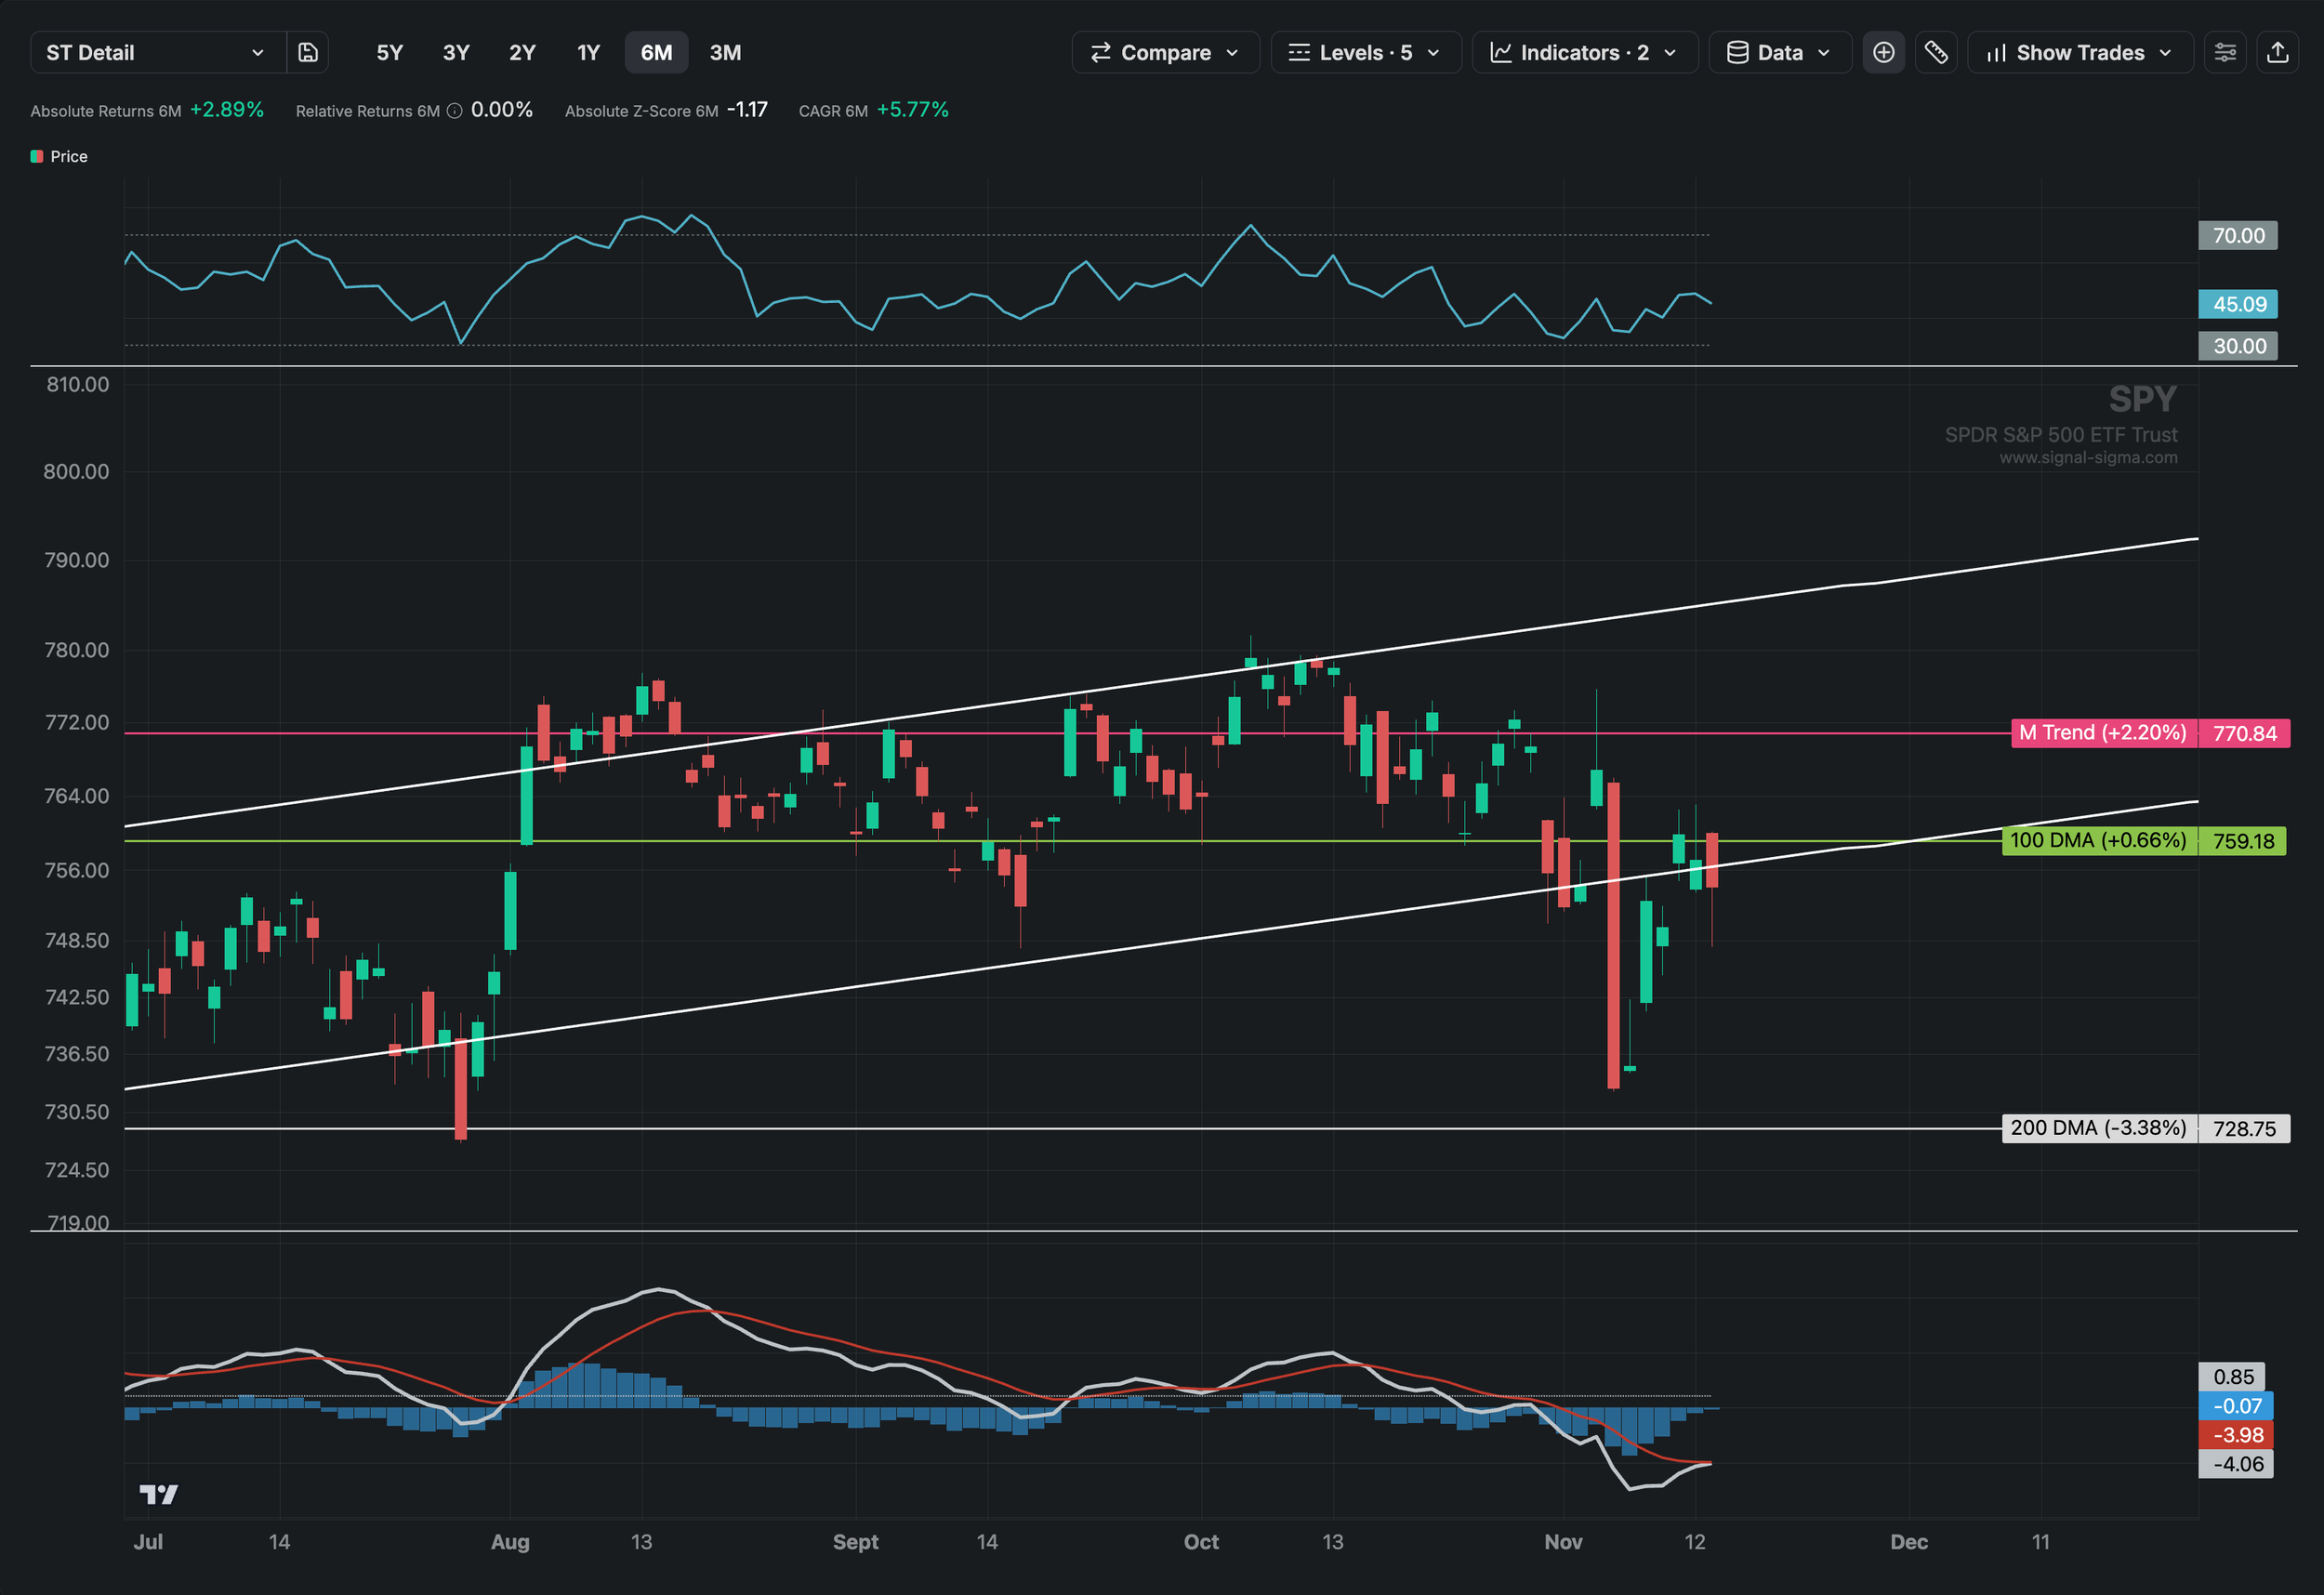
Technically speaking, SPY now finds itself in an intermediate corrective phase within a primary bullish backdrop. After establishing a high of $779 on October 6, SPY faced exhaustion near the channel median, culminating in a sharp pullback to $733 post midterm elections. The subsequent bounce and consolidation at $754 indicate that buyers successfully defended the lower quartile of the trend channel ahead of primary support.
Key support sits at S1 ($727 - S1, 200-DMA), closely backed by the recent swing low of $733 and the rising channel lower boundary at $697. A breach below $727 would trigger deeper mean-reversion toward S2 ($665). Most critically, a close below $733 would break the pattern of higher lows. That break would strengthen the case for raising cash and adding hedges to portfolios.
On the upside, overhead resistance is concentrated at the convergence of several moving averages, most notably the 100 and the 50-DMA ($759 - $764 range).
Options positioning revealed a stark bifurcation between short-dated tactical dip-buying and aggressive medium-to-long-term hedging as SPY consolidated. Downside contract activity into December 2026 and March 2027 indicates institutional skepticism regarding the sustainability of the rally above $750.
Dark pools data confirms that institutional market participants are actively offloading risk into this volatile options landscape. Over the trailing three months and one month, dark buy ratios stood at constructive levels of 1.29 and 1.15, respectively. However, institutional demand has deteriorated sharply in recent sessions. The 1-day dark buy ratio plunged to 0.79, with 7.12 million shares sold versus 5.60 million bought out of 12.72 million total dark shares. Consequently, the 1-day Dark Pools Index dropped to 44.04%, well below its 3-month average of 56.29%.
The convergence of heavy institutional distribution in off-exchange venues and dealer short-gamma exposure creates a distinct downside vulnerability for SPY over the next 1–2 weeks. In the event of selling pressure, dealer hedging will likely exacerbate price drops.
The short term technical stance is not helping either, with Friday’s close not managing to reclaim the 6-Month trendline boundary or the 100-DMA. The most likely outcome is a choppy consolidation and potential retests of the $733–$740 support zone over the next two to four weeks as dealer hedging and dark pool distribution work through the tape. Once this defensive positioning clears and negative gamma rolls off, the prevailing macro momentum should reassert itself toward Goldman’s 2027 S&P 500 price target of $8700.
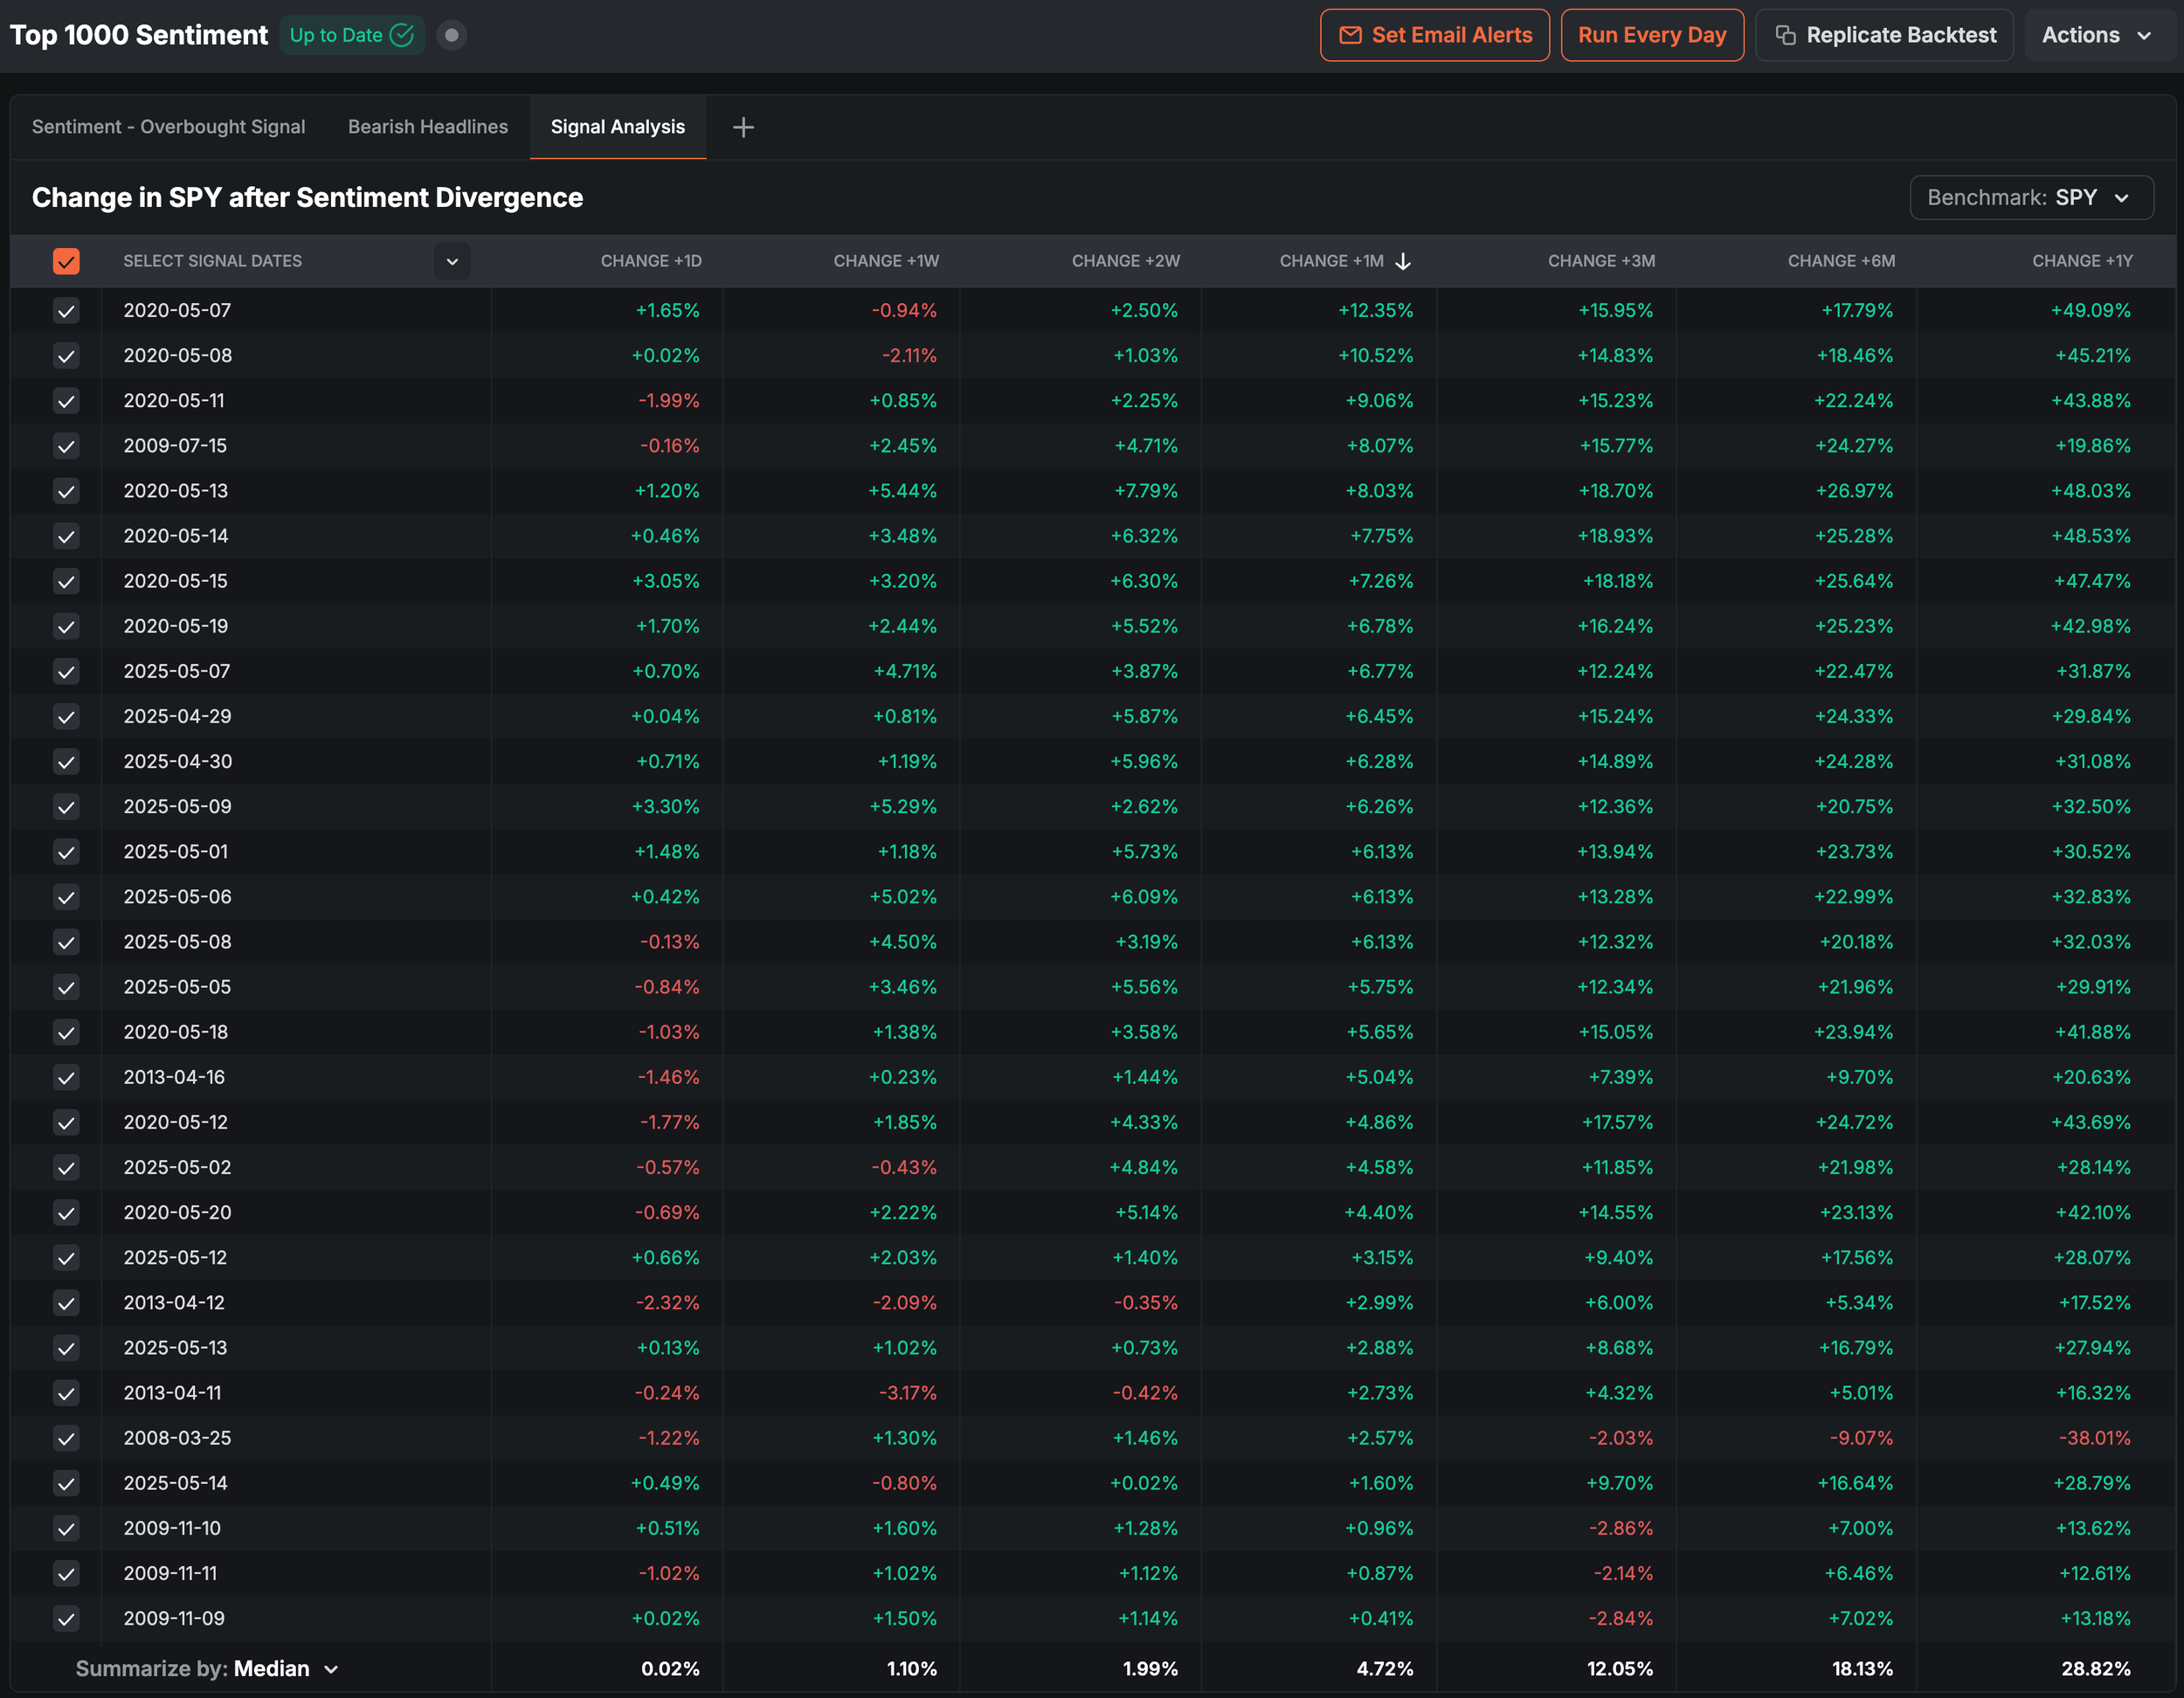
Investor sentiment has triggered a rare divergence signal. More than 51% of AAII survey respondents hold bearish views as of Thursday. By itself, this reading is unusually high, but doesn't work as a contrarian signal all the time. Such readings preceded legitimate bear market periods in the past (the start of 2022 for instance). However, extreme bearish sentiment may sometimes be unwarranted.
That's what our signal is designed to flag. In the upper panel, we compute our own internal sentiment reading, which is a derivative of market breadth and individual price strength. When our metric is at least neutral (> 55) and the AAII survey is majority bearish (>51% bears), the signals get triggered.
They happen to coincide with periods when the market was coming out of a deeper correction / bear territory. We are also seeing the same signal fire today, as sentiment is decidedly bearish yet unconfirmed by breadth metrics. The sentiment divergence signal is extremely bullish, with high win rates, averages and medians across virtually all time horizons.
The reason for this divergence is the sector relative performance map. We can visualize both the absolute and relative-to-SPY Z-Scores for major ETFs below. Health Care (XLV) and Staples (XLP) are the most stretched. Six out of / 12 sectors are outperforming SPY on both the 2Y Z-Score and 1-Year returns. Yet the group of outperforming sectors are not particularly owned by the majority of retail stock pickers and they don’t constitute such a large share of the headline index.
The only oversold groups — Tech (XLK), Industrials (XLI) and Communications (XLC) — all AI / momentum themed — are retail favorites by contrast. The underperformance of these names makes the market “feel” much worse than it is, sending sentiment measures like the AAII survey into bearish territory.
Furthermore, nine out of 12 sector ETFs are beating SPY on a 1-Month relative return basis. That is real “broadening.” The bull case is clear: If 9 of 12 sectors are beating the index, the market must be healthy. And it is, below the surface. But a cap-weighted index can’t make a new high while its largest sector underperforms.
And here lies the bear case: while tech may catch up to the market, the market may as well catch down to tech. That’s why Tuesday’s Nvidia report matters for the whole tape, not just for one stock.
Two stories will drive the markets this week. The first is Nvidia’s first earnings report without Jensen Huang.
The second is the reaction to a Fed that continues to signal a December rate hike is on the way. Almost everything else on the calendar feeds one of those two narratives.
Nvidia reports fiscal third-quarter results Tuesday after the close. Consensus looks for roughly $2.47 per share on revenue near $109 billion, slightly above the company’s own guidance of about $108 billion. But the Q3 numbers are not the key issue. Investors will be focused on three things: guidance, how much of the backlog depends on customer financing, and what Colette Kress says about the CEO search.
Home Depot and Disney report Tuesday morning, followed by Lowe’s, Target, and TJX on Wednesday. Walmart wraps up the retail earnings circuit Thursday morning.
On the economic calendar side, there are plenty of Fed speakers. Chair Kevin Warsh speaks Monday at noon ET. John Williams follows with remarks Monday, Tuesday, and Wednesday. Christopher Waller, who raised the possibility of a half-point hike after the CPI report, speaks Tuesday and Friday. The October FOMC minutes are released Wednesday afternoon.
October retail sales arrive Tuesday, with consensus looking for a 0.8% gain, alongside industrial production. Housing starts follow on Wednesday, after last week’s dismal existing-home sales report. Thursday brings jobless claims and the Philadelphia Fed survey, while Friday closes the week with the final University of Michigan sentiment reading.
Most importantly, we’ll be watching the retail sales control group closely. This core measure excludes autos, gasoline, and building materials and feeds directly into GDP calculations. With mortgage rates above 7% and consumer prices still rising 0.4% per month, a soft reading would be the first clear signal that higher rates are beginning to weigh on shoppers.
The focal point of the week remains NVDA earnings on Tuesday. Weak guidance combined with a leadership vacuum would validate the market’s repricing. In turn, a further drop in NVDA would likely drag the entire index back toward its 200-day average. The upside case is less clear. Still, a clean beat, credible financing commitments, and a calm succession process (especially with the stock already deeply oversold) could attract buyers, especially given the already defensive options structure.
In the immediate term, the price is strongly supported by the $143.00–$147.24 put wall complex, which should absorb short-term post-earnings shocks. Although aggressive offer-lifting on near-dated puts reflects heavy demand for tail risk protection, medium-term options structures show decisive bullish divergence.
For January 15 and March 19, 2027 expiries, put/call volume ratios have plunged to 0.34 and 0.22, respectively, driven by robust call open interest expansion and call walls spanning $230.20 to $248.05. This profile demonstrates that institutional money is utilizing near-term volatility spikes to build multi-month upside exposure.
Our Trading Strategy (Sigma Portfolio)
Hedge fund net exposure sits at five-year lows, long/short funds just recorded their largest cut in gross exposure since Covid, and Thursday marked the heaviest day of put buying in CBOE history. With tech and semiconductors in a bear market, sentiment is understandably bearish by multiple metrics. Yet the average stock is holding up much better than perceived.
The forced sellers have mostly sold. Excess leverage has already decimated the most vulnerable portfolios.
Of course, “oversold can always get more oversold”. But that’s not the argument we’re making here. History tilts the odds to higher prices from here, if looking at seasonality, sentiment and several options / dark pools flows. “Good odds” do not translate into “zero risk”, however.
We’re looking for a successful retest of primary support coupled with the reclaim of major moving averages in QQQ and SPY. The Enterprise strategy will eventually move to overweight risk when the time is right. Our various market regime studies will also print bullish.
We will attempt to add risk exposure on the retest and reclaim, but honor stop losses as well, if the market breaks.
Disclosures / Disclaimers: This is not a solicitation to buy, sell, or otherwise transact any stock or its derivatives. Nor should it be construed as an endorsement of any particular investment or opinion of the stock’s current or future price. To be clear, I do not encourage or recommend for anyone to follow my lead on this or any other stocks, since I may enter, exit, or reverse a position at any time without notice, regardless of the facts or perceived implications of this blog post. I currently do not own or plan to own any position, long or short, in the securities mentioned.
I am not a financial advisor licensed in the United States. Nor am I providing any recommendations, price targets, or opinions about valuation regarding the companies discussed herein. Any disclosures regarding my holdings are true as of the time this article is written, but subject to change without notice. I frequently trade my positions, often on an intraday basis. Thus, it is possible that I might be buying and/or selling the securities mentioned herein and/or its derivative at any time, regardless of (and possibly contrary to) the content of this blog post.
I undertake no responsibility to update my disclosures and they may therefore be inaccurate thereafter. Likewise, any opinions are as of the date of publication, and are subject to change without notice and may not be updated. I believe that the sources of information I use are accurate but there can be no assurance that they are. All investments carry the risk of loss and the securities mentioned herein may entail a high level of risk. Investors considering an investment should perform their own research and consult with a qualified investment professional.
I wrote this blog post myself, and it expresses my own opinions. I do not have a business relationship with any company whose stock is mentioned in this blog post. The information in this blog post is for informational purposes only and should not be regarded as investment advice or as a recommendation regarding any particular security or course of action.
The primary purpose of this blog post is to share industry expertise and research and receive feedback (confirmation / refutation) regarding my investment theses.