
-
Monday:
Fed Speakers
---
Tuesday:
Core Inflation Rate MoM (0.2% exp.)
Core Inflation Rate YoY (2.8% exp.)
Inflation Rate MoM (0.3% exp.)
Inflation Rate YoY (3.9% exp.)
---
Wednesday:
N/A
---
Thursday:
Existing Home Sales (3.98M exp.)
---
Friday:
PPI MoM (0.4% exp.)
-
This section has been moved to the Market Updates / Events Calendar tab
Midterms Crash The Market - What’s Next?
Got a question about the markets, your investments, or a topic you’d like us to discuss in an upcoming article? We read every message and may feature your question in our daily write-ups!
Email: andrei@signal-sigma.com
Follow & DM on X: @signal_sigma
Last week was unusually brutal for stock investors. On Monday, we were watching the key 100-DMA level on the S&P 500 being breached to the downside, as hedging demand ahead of the elections drove defensive flows. Wednesday produced what Fortune labeled the strongest post-midterm election rally in 44 years, as the S&P 500 rose +1.6% to close at 7,688.62.
24 hours later, $3 trillion in market capitalization was erased. The Nasdaq lost -6.4% and the S&P 500 fell -4.4% in its worst single day performance since the April 2025 tariff crash. The semiconductor ETF (SMH) fell roughly -11%, while Micron and AMD each declined about -17% and Nvidia dropped -9%.
This jarring sequence of events means the market is now 5.7% below the October 6 record and up only +7.8% for the year. Negative catalysts were stacked on top of each other.
Democratic victories in Texas, Georgia, Ohio, and Michigan put about 45% of planned data center capacity in states expected to impose tighter regulations, according to Goldman Sachs. Soft results from Qualcomm and Arm weighed on the broader chip sector. Asian markets then declined, and the weakness extended to the power companies supporting the data center buildout. Politics lit the match, but high leverage was the fuel.
Going into the elections, Goldman’s prime brokerage data showed hedge fund gross leverage near 310% (close to a five-year high) after funds lost more than 3% in October. Significant team cuts and capital returns were reported in the industry, with firms like Walleye Capital (~17B), Engineers Gate and Millennium Management reporting restructurings.
Friday offered a partial recovery, with the market holding key technical support, though only narrowly, after the October payrolls came in hotter than expectations. Employment rose by 165,000, well above the 65,000 forecast, and the unemployment rate declined to 4.1%. Revisions also added another 84,000 jobs to the August and September figures, while hourly earnings increased 0.4%.
The stronger-than-expected labor data kept the possibility of a December rate hike on the table, which is not what a growth focused market wants to hear.
Chip stocks rebounded on Friday, yet the broader market managed only a +0.3% gain and faded from an intraday high of 7,444 to finish near the session’s low.
Weekly Sector Returns
Beneath the alarming headlines, the selling was narrower than it appeared. The equal-weight S&P 500 (RSP) outperformed the cap-weighted index by 1.7 percentage points. The 2Y Relative-to-SPY Z-Score is now at 2.15, an extremely high value that is unlikely to last. The relative Z-Score between SPY and RSP is a highly mean reverting series over time.
Every time (as in 100% of events) when the relative Z-Score went above 2.0 (purple shading on the chart below), SPY was higher 3, 6 and 12 months later, with median and average returns FAR above normal (screenshot below chart - study link here). However, the worst 1-Month drawdown reached -8% from similar levels, so the shape of the returns can be uneven.
The key question heading into next week is whether Thursday marked a one-time liquidation event or the beginning of a broader trend. Liquidations typically burn themselves out quickly, often within a few sessions. Once forced selling ends, margin calls subside, and the leverage accumulated during the prior rally is cleared from the system. Trends are a different beast. Tuesday’s CPI report will clarify the direction of rates while the market works through the selling pressure.
Despite the positive outcome suggested above, there can be no sugarcoating: Thursday’s selloff did some real damage. SPY blew through the key 100-DMA support and now trades below all of the major moving averages save for the 200-DMA.
In turn, the 200-DMA (coinciding with the S1 level, -1.44%) is the major support that the market is now counting on. Heavy resistance sits +3% higher, as all of the other moving averages, as well as the 6M trendline occupy the $757-$765 price range. This makes the risk / reward setup for a bounce mainly favorable (+3% / -1.4% from current levels).
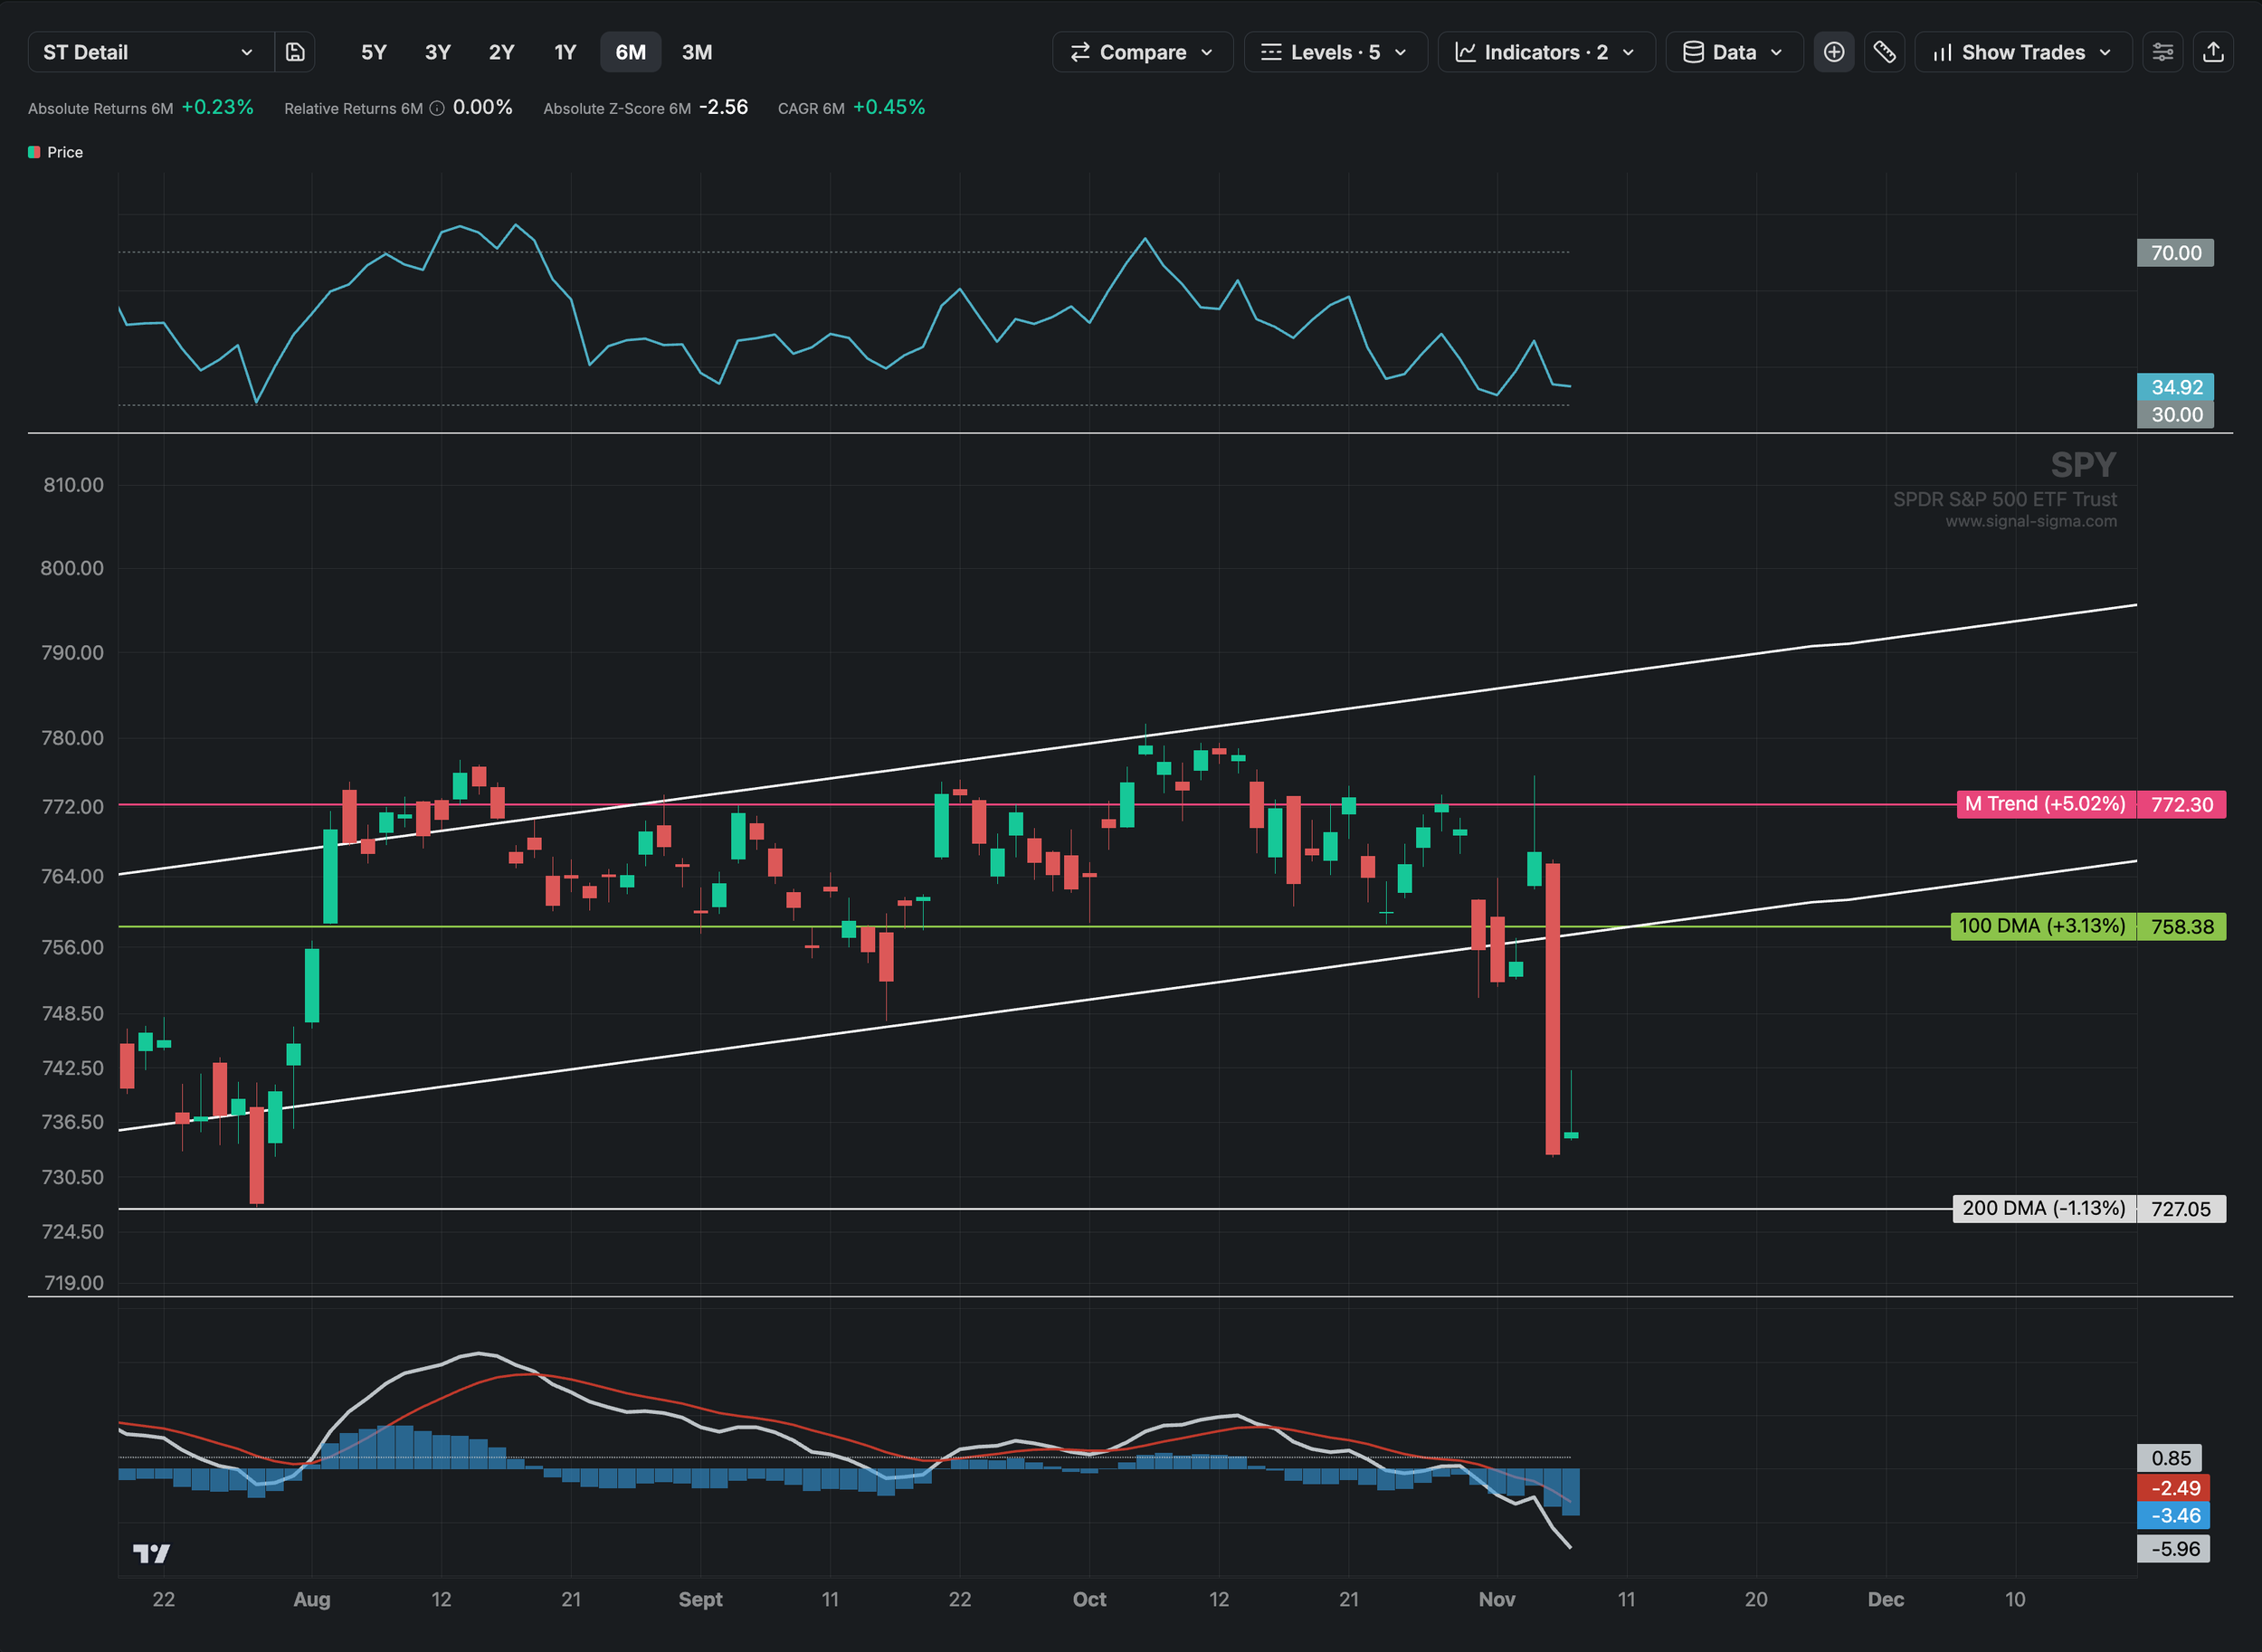
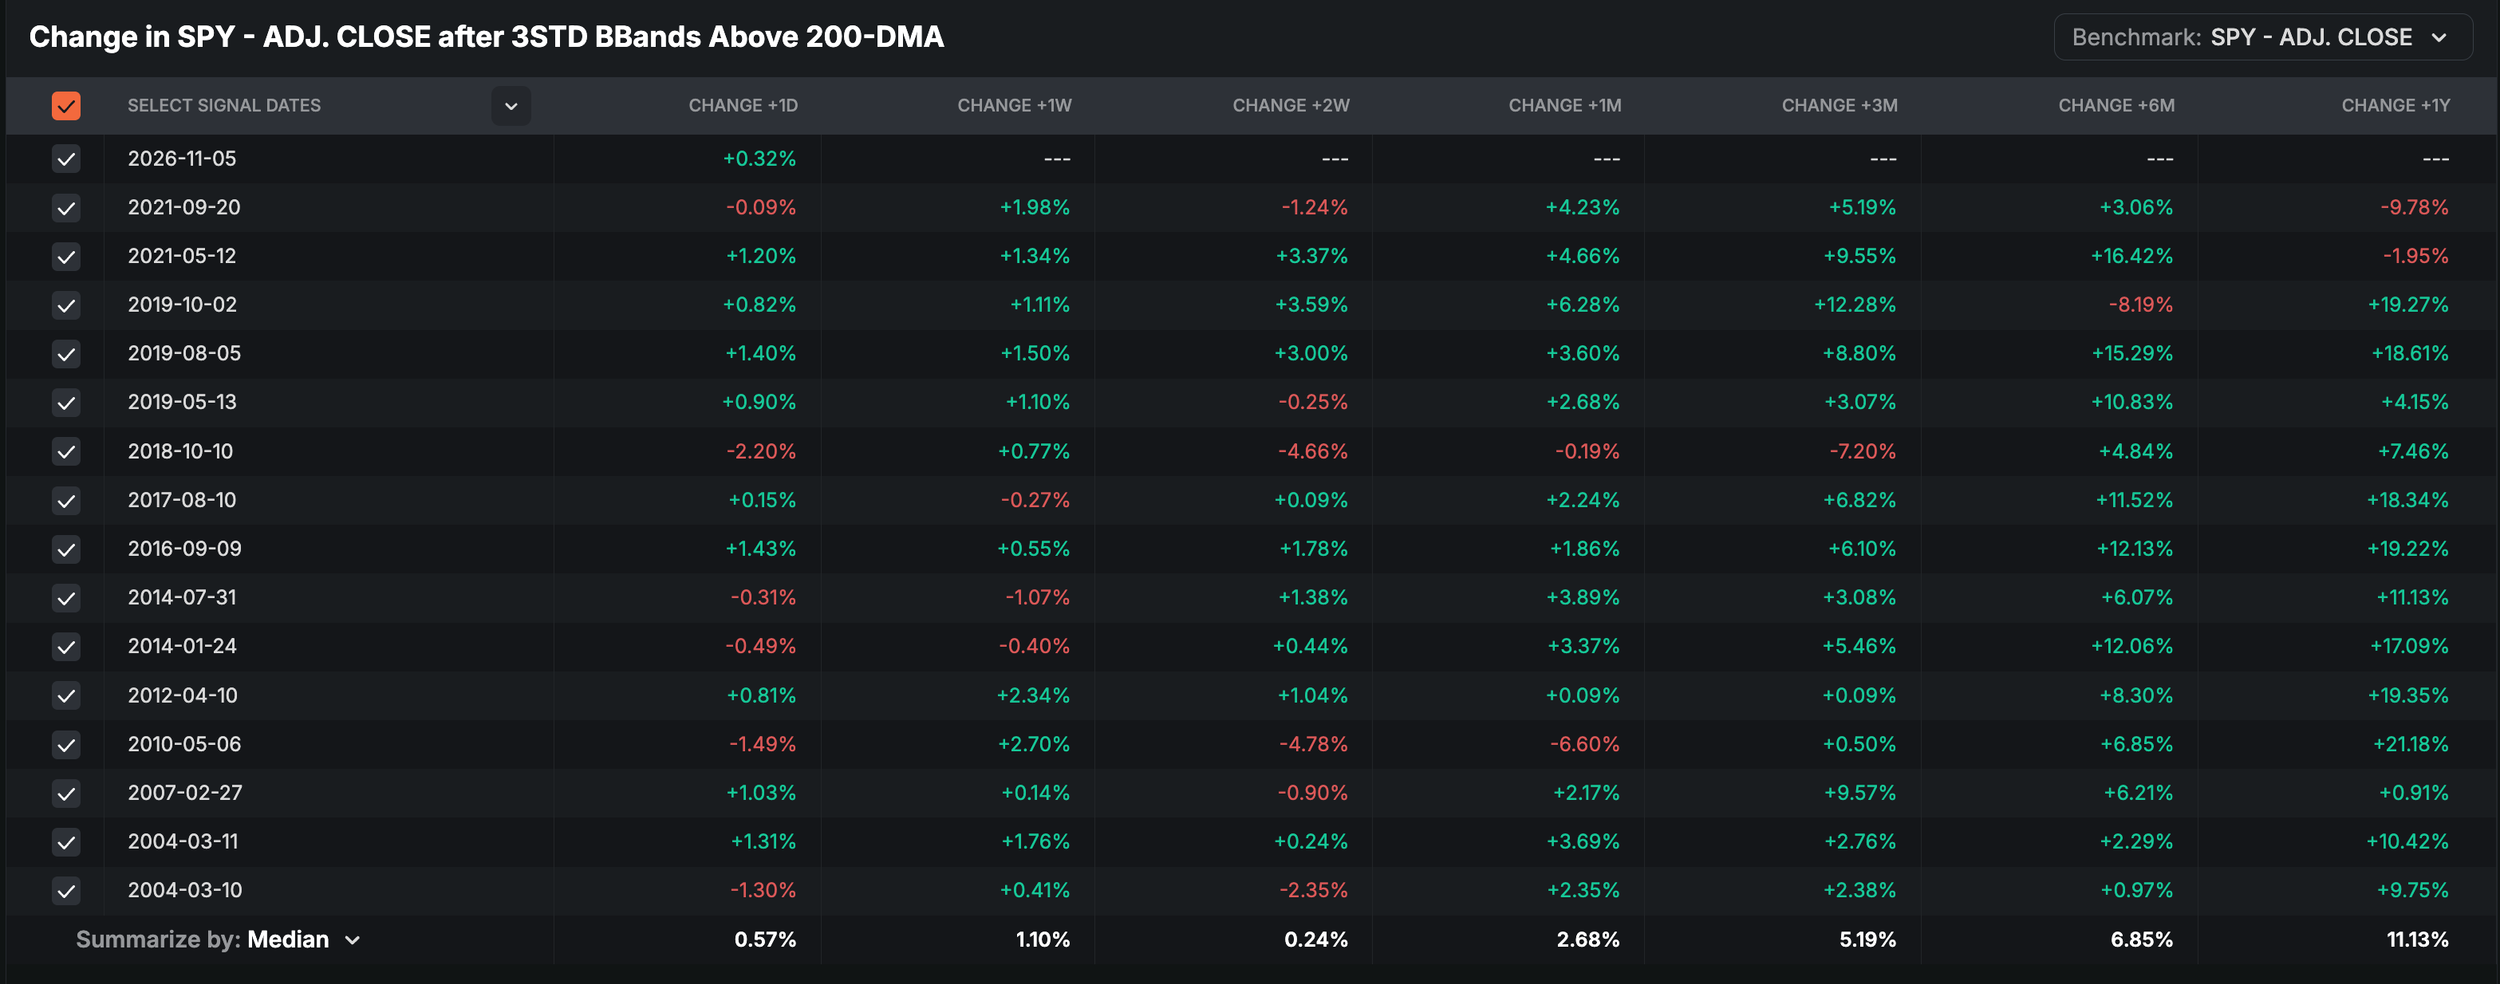
The dip-buying crowd also has hope from the extreme downside deviation that we’re currently experiencing in SPY. Thursday’s close pushed the market 3.1 standard deviations below the 20-DMA. This is rarely a long lasting condition.
In our analysis, we found 16 instances in the past 26 years when the index stretched this far below its 20-day average while holding above its 200-day average. One month later, the market was higher in 13 out of those cases, with a median gain of +2.68%.
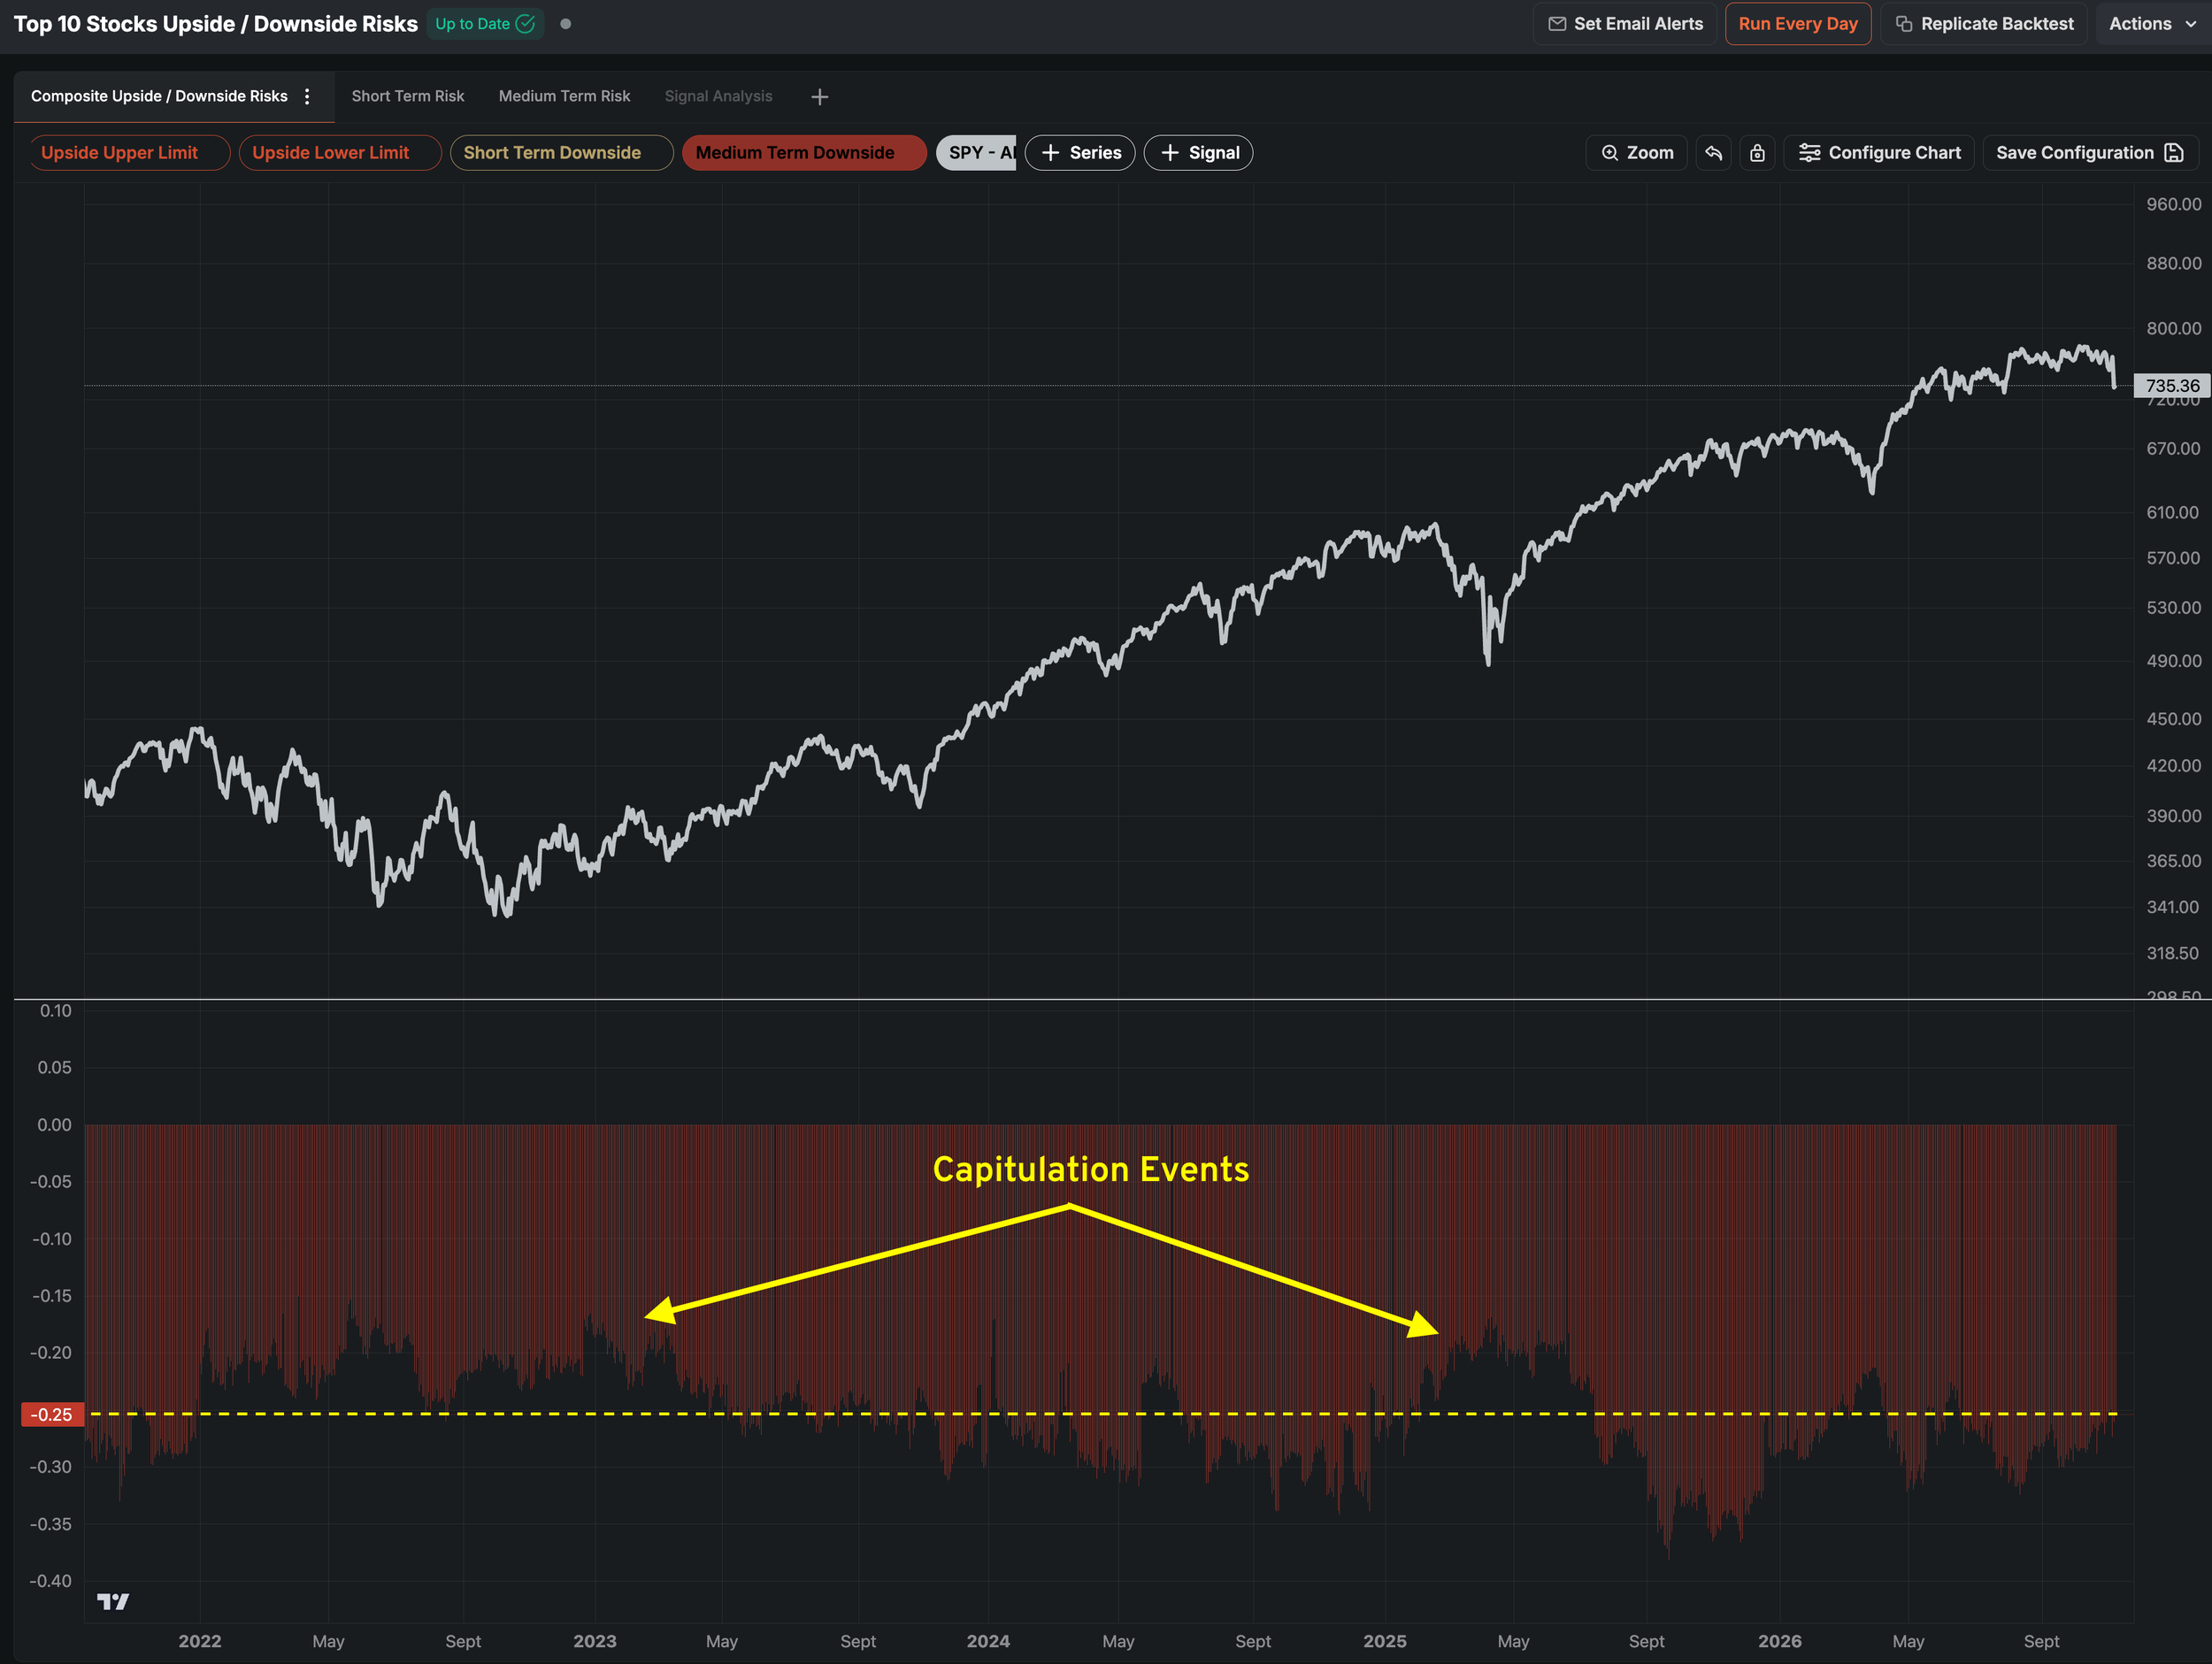
However, the calculus changes significantly if the 200-DMA support breaks down. Current conditions are not nearly at levels consistent with true “capitulation”. What we’re experiencing is a sharp correction that mainly hit tech and momentum stocks. These types of events are not by any means unusual and they still happen within the context of a bull market.
It’s a totally different story if the bull market condition is no longer maintained. The two studies below illustrate what a major bottom looks like from the perspective of topping pattern breadth as well as options market implied downside risk. Neither of these metrics is at previous historical extremes (and neither is a short term measure, for that matter).
Friday’s price action is very telling. The S&P 500 index opened near 7,378, climbed to 7,444, then surrendered the entire gain by the close. Sellers continue to show up on every bounce.
If the 200-day moving average holds and semiconductors reverse higher, exposure can be added on the bounce in small increments. A decisive close below 7,316 (July’s swing low) would open the path toward 7,200. A break of that level would shift the tone decisively bearish and raising cash becomes the more prudent option.
Inflation data will set the tone this week, and the timing is… not ideal, to say the least.
Tuesday brings the October CPI report, with consensus looking for a 0.3% monthly rise (half the size of September’s 0.6% increase), while core inflation is expected at 0.2%. Friday’s PPI follows, with forecasts at 0.4% after September’s 1.3% jump. Coming on the heels of the 165,000 payroll gain, a hotter-than-expected print on either measure would lift the odds of a December rate hike at precisely the wrong time.
The Treasury market also faces a crowded schedule. Auctions of 3-, 10-, and 30-year notes and bonds are set for Monday, Tuesday, and Thursday. The bond market is closed Wednesday for Veterans Day, though equities will trade as usual. Thursday afternoon’s budget statement will update how October’s deficit is tracking, with consensus near $298 billion.
Federal Reserve officials are speaking throughout the week.
Notably, earnings season is coming to a close, although there are still key reports further down the line (NVDA in particular). Constellation Energy’s report this morning will set the tone for data center power contracts, in light of the recent election results in Texas.
CoreWeave reports Tuesday after the close and we’ll get color regarding the debt funded “neocloud” model.
Thursday we’ll get Applied Materials and Cisco Systems, giving a read for enterprise AI networking spend.
Tech remains at risk, especially as NVDA’s Jensen Huang is coming under internal investigation for an affair with a Chinese intelligence operative.
In the background, political noise will continue. In every election cycle, some media outlet inevitably claims that markets perform better under one party than the other. The data, however, does not support that view.
Sorting the 19 midterm elections since 1950 by the resulting government configuration - from unified control to a split Congress - and measuring the S&P 500’s performance twelve months later shows little difference. The current setup, a Republican president facing a Democratic Congress, averaged a +15.5% gain across seven instances. The full set of 19 midterms averaged +15.1%. Every configuration was positive on average, and none of the 19 cycles ended the following year lower.
The midterm election cycle itself drives the outcome more than the party that wins.
Across the history of four-year presidential cycles, midterm years typically produce the deepest drawdowns. By Election Day, much of the uncertainty is already reflected in prices. Once the votes are counted, that discount tends to unwind regardless of which party gets the power. Investors do not require a friendly Washington, they just need a predictable one, and gridlock is about as predictable as Washington gets.
These are the seven midterm elections that produced a Republican president facing a Democratic Congress, measured from the Election Day close. The averages are strong: the index rose 10.7% after three months, 17.5% after six, 20.1% after nine, and 15.5% after a full year—outperforming the 19-cycle average at every horizon. All seven were higher at every checkpoint.
However, the averages hide the path. That’s why the Max Drawdown column exists. In 1986, when Democrats took the Senate under Reagan, the market gained 28% after 9 months. Then, October 1987 happened and markets got hit with a -33% drawdown.
In any case, the sample size here is small, so it acts as more of a seasonal bias than an outright prediction. Even an impeachment rarely makes for a bear market. In theory, a government shutdown would cause increased anxiety, but they’ve been used for political posturing and media attention lately. As such, the markets are not in real trouble on this front.
In conclusion, history suggests market participants should stay invested through the November-to-April window. Since 1950, this six-month period has advanced in all 19 midterm years, averaging a +14.8% gain according to Carson Investment Research. It has never required a friendly Congress to do so.
While history tilts the odds, it’s equally important to remember that it does not manage risk. There are certainly issues within the AI space, especially relating to circular financing deals and companies funding the buildout with borrowed money. A state permitting freeze can lead to a cascade of negative events.
Our Trading Strategy (Sigma Portfolio)
Generally speaking, it has always been a good idea to buy tech on weakness, especially if the broader market holds. We are now finally starting to get some real washed out charts in ETFs like XLK, QQQ and SMH, which are still holding trendline support even after the sell-off.
We are now at around 20% allocation to cash, so the dry powder is there to benefit from the weakness. The condition is for technical support to hold, and for our studies to turn risk-on. We are especially looking at the Enterprise strategy (and regime) as well as the broader SPY Buy Regime to turn up. It would also be useful for Topping Patterns breadth to stop signaling increased risk, with sufficient upside indicated by the options market.
We’ll keep you in the loop via trade alerts.
Disclosures / Disclaimers: This is not a solicitation to buy, sell, or otherwise transact any stock or its derivatives. Nor should it be construed as an endorsement of any particular investment or opinion of the stock’s current or future price. To be clear, I do not encourage or recommend for anyone to follow my lead on this or any other stocks, since I may enter, exit, or reverse a position at any time without notice, regardless of the facts or perceived implications of this blog post. I currently do not own or plan to own any position, long or short, in the securities mentioned.
I am not a financial advisor licensed in the United States. Nor am I providing any recommendations, price targets, or opinions about valuation regarding the companies discussed herein. Any disclosures regarding my holdings are true as of the time this article is written, but subject to change without notice. I frequently trade my positions, often on an intraday basis. Thus, it is possible that I might be buying and/or selling the securities mentioned herein and/or its derivative at any time, regardless of (and possibly contrary to) the content of this blog post.
I undertake no responsibility to update my disclosures and they may therefore be inaccurate thereafter. Likewise, any opinions are as of the date of publication, and are subject to change without notice and may not be updated. I believe that the sources of information I use are accurate but there can be no assurance that they are. All investments carry the risk of loss and the securities mentioned herein may entail a high level of risk. Investors considering an investment should perform their own research and consult with a qualified investment professional.
I wrote this blog post myself, and it expresses my own opinions. I do not have a business relationship with any company whose stock is mentioned in this blog post. The information in this blog post is for informational purposes only and should not be regarded as investment advice or as a recommendation regarding any particular security or course of action.
The primary purpose of this blog post is to share industry expertise and research and receive feedback (confirmation / refutation) regarding my investment theses.