
/ August 17 / Weekly Preview
-
Monday:
NY Empire State Manufacturing Index (11 exp.)
---
Tuesday:
Building Permits (1.37M exp.)
Housing Starts (1.35M exp.)
---
Wednesday:
FOMC Minutes
---
Thursday:
Initial Jobless Claims (212K exp.)
---
Friday:
S&P Global Services PMI Flash (54 exp.)
-
Monday:
N/A
---
Tuesday:
Home Depot, Inc. (The)
BHP Group Limited
Keysight Technologies Inc.
Baidu, Inc.
---
Wednesday:
Analog Devices, Inc.
TJX Companies, Inc. (The)
Lowe's Companies, Inc.
Target Corporation
---
Thursday:
Walmart Inc.
Alibaba Group Holding Limited
Deere & Company
Ross Stores, Inc.
---
Friday:
N/A
The Chase Is Back On
Got a question about the markets, your investments, or a topic you’d like us to discuss in an upcoming article? We read every message and may feature your question in our daily write-ups!
Email: andrei@signal-sigma.com
Follow & DM on X: @signal_sigma
Over the past week, stocks reached new highs as investors priced in a reduced likelihood of a September rate increase by the Fed. Both CPI and PPI prints came in softer than expected and Friday’s weak retail sales report actually contributed to a lower finish into the week’s close.
The S&P 500 still added +0.4% and notched its third straight weekly gain. The Nasdaq fared worse (+0.1%), but still managed to finish in the green, with leadership from the Communications sector (XLC), as well as Tech (XLK), AI and memory names. The Dow lagged with a -0.6% decline, while the Russell 2000 finished flat. Energy (XLE) was a laggard despite higher oil prices and the run to record highs became a Tech-driven affair once again.
Under the hood, it was the bond market that dictated proceedings.
The 10-year Treasury yield edged higher to 4.69% in response to rising oil prices, while weak economic data brought the “Fed on hold” narrative forward and drove the 2-year toward 4.13%. Volatility remained subdued, with the VIX holding around 14.6.
As the Equally Weighted S&P 500 (RSP) outperformed its cap weighted sibling (SPY), breadth figures improved and the average stock finished higher than the mega-caps. There is nothing bearish about this development, and the market’s overall trend could not be much cleaner.
The S&P 500 is trading above all key moving averages and remains above a rising 200-DMA it hasn't closed below since April. This is a robust, intact uptrend that we need to respect. Bears will note that the deviation above the 200-DMA has once again become extended, with a complete regression implying an almost -10% drop. Normalized, the deviation now sits at the 79’th percentile, with readings above 70 being the hallmark of a bull market and signalling above average outcomes in the year to come (+15% median returns).
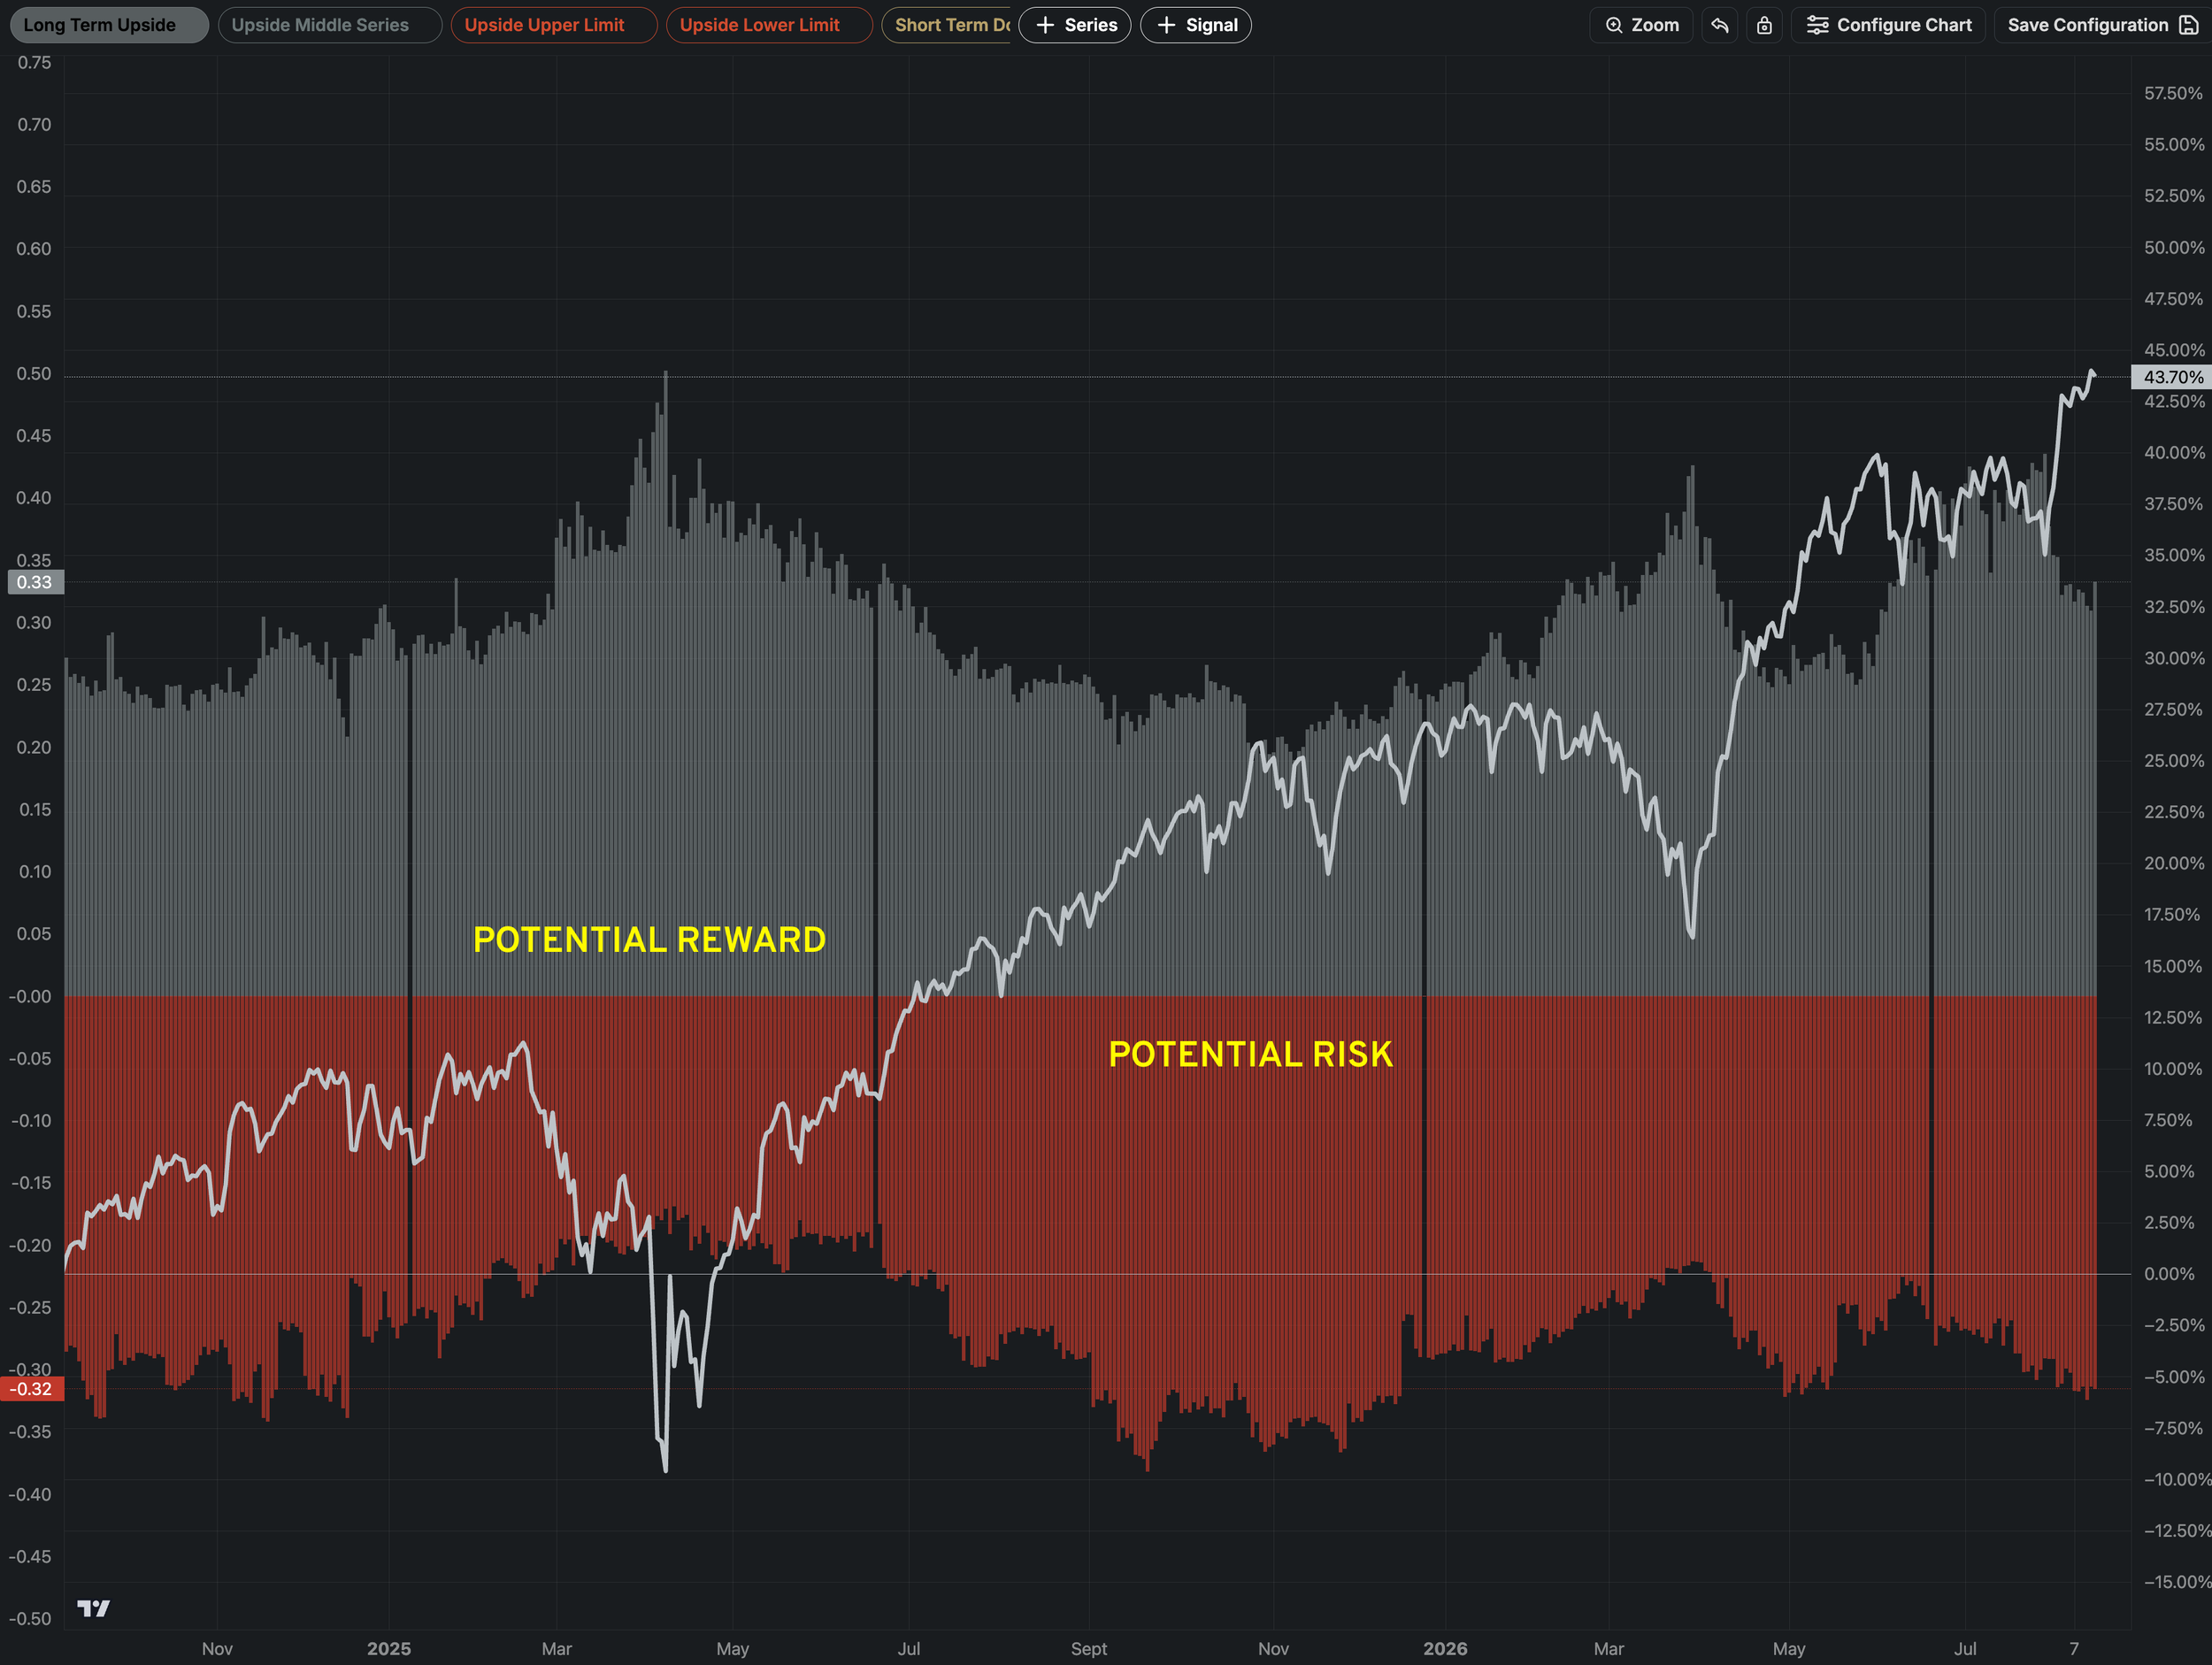
The only small caution flag is the technical resistance level at $782 (R1), which doesn’t give bulls a lot of headroom. On the contrary, the technical risk/reward setup is skewed to the downside, with much more room below than above.
The first support stands at 754 (20-DMA), but we would expect the M-Trend at $745 (coinciding with the 50-DMA) to be the place where buyers show up. That’s roughly -3.7% risk for not a lot of upside. There’s little cushion above, and plenty of open air below, down to these levels. However, a pullback would be a routine event within an uptrend and not signal a break.
This week brings us fresh insights into two key data points: the consumer and the Fed.
Retail bellwethers (Walmart, Ross Stores, Alibaba) will provide a real-time follow-up to Friday’s weak retail sales print, gauging consumer health. On the policy front, FOMC minutes on Wednesday and the Jackson Hole symposium beginning Friday will refocus debate on the rate path ahead of the September 16 Fed meeting.
Are elevated oil prices beginning to curb demand in the economy? Is weaker job growth indicating the economy is slowing more than expected? We’ll get answers to these questions by Friday.
If retailers confirm Friday’s weak sales and the FOMC minutes indicate the Fed tilts dovish, the “Fed on hold” narrative gains credibility. A hawkish surprise at Jackson Hole would quickly challenge the risk-on rally. Either way, the market still thinks the Fed will hike at least once by August 2027, even though the timing of that hike was pushed back to December.
The key reports were CPI and PPI, so let’s look into them.
July CPI increased 0.1% month-on-month and 3.4% year-on-year; core CPI rose 0.2% month-on-month and 2.5% year-on-year. These figures were in line with expectations, with shelter accounting for most of the rise. However, shelter is a lagging component the Fed is likely to downplay. The next morning, PPI was flat at 0.0% versus a 0.2% expected gain, and the annual rate eased to 4.7% from 5.5%. Final demand goods prices fell -0.7%. The tariff “passthrough” that hawks have warned about has yet to materialize in the pipeline.
As such, the September meeting won’t be about rate hikes. Instead, a minority of “hawks” will face pressure in maintaining their dissenting opinions. For equity bulls, this is good news, as the Fed on hold removes a macro tail risk that threatened this richly priced market.
Speaking of bulls, buyers are coming out of the woodwork again, with both retail and institutions bidding up stocks. The weekly Dark Pools index on SPY was nearly 67%, a very high number signalling professional investors have bought the rally on the way up.
This could make sense from the perspective of earnings growth, with Q2 profits for the S&P 500 index growing roughly 33%, one of the steepest revision paths in a quarter century. As a result, the forward multiple has actually fallen to about 20x earnings from 23 last October, below the 5-Year average and not far above the 10-Year average of 19.4x.
Since earnings growth is the metric compressing the multiple (and not the “easy money” multiple expansion that came post-Covid), the cheapening of the market is good news.
Passive demand has remained robust according to Citadel’s Scott Rubner. Households pushed a record $350 billion into ETFs in July alone, contributing to a record $1.6 trillion in inflows year-to-date.
Furthermore, more than a trillion dollars of buyback authorizations reopen this month, and nearly 70% of them sit outside Technology.
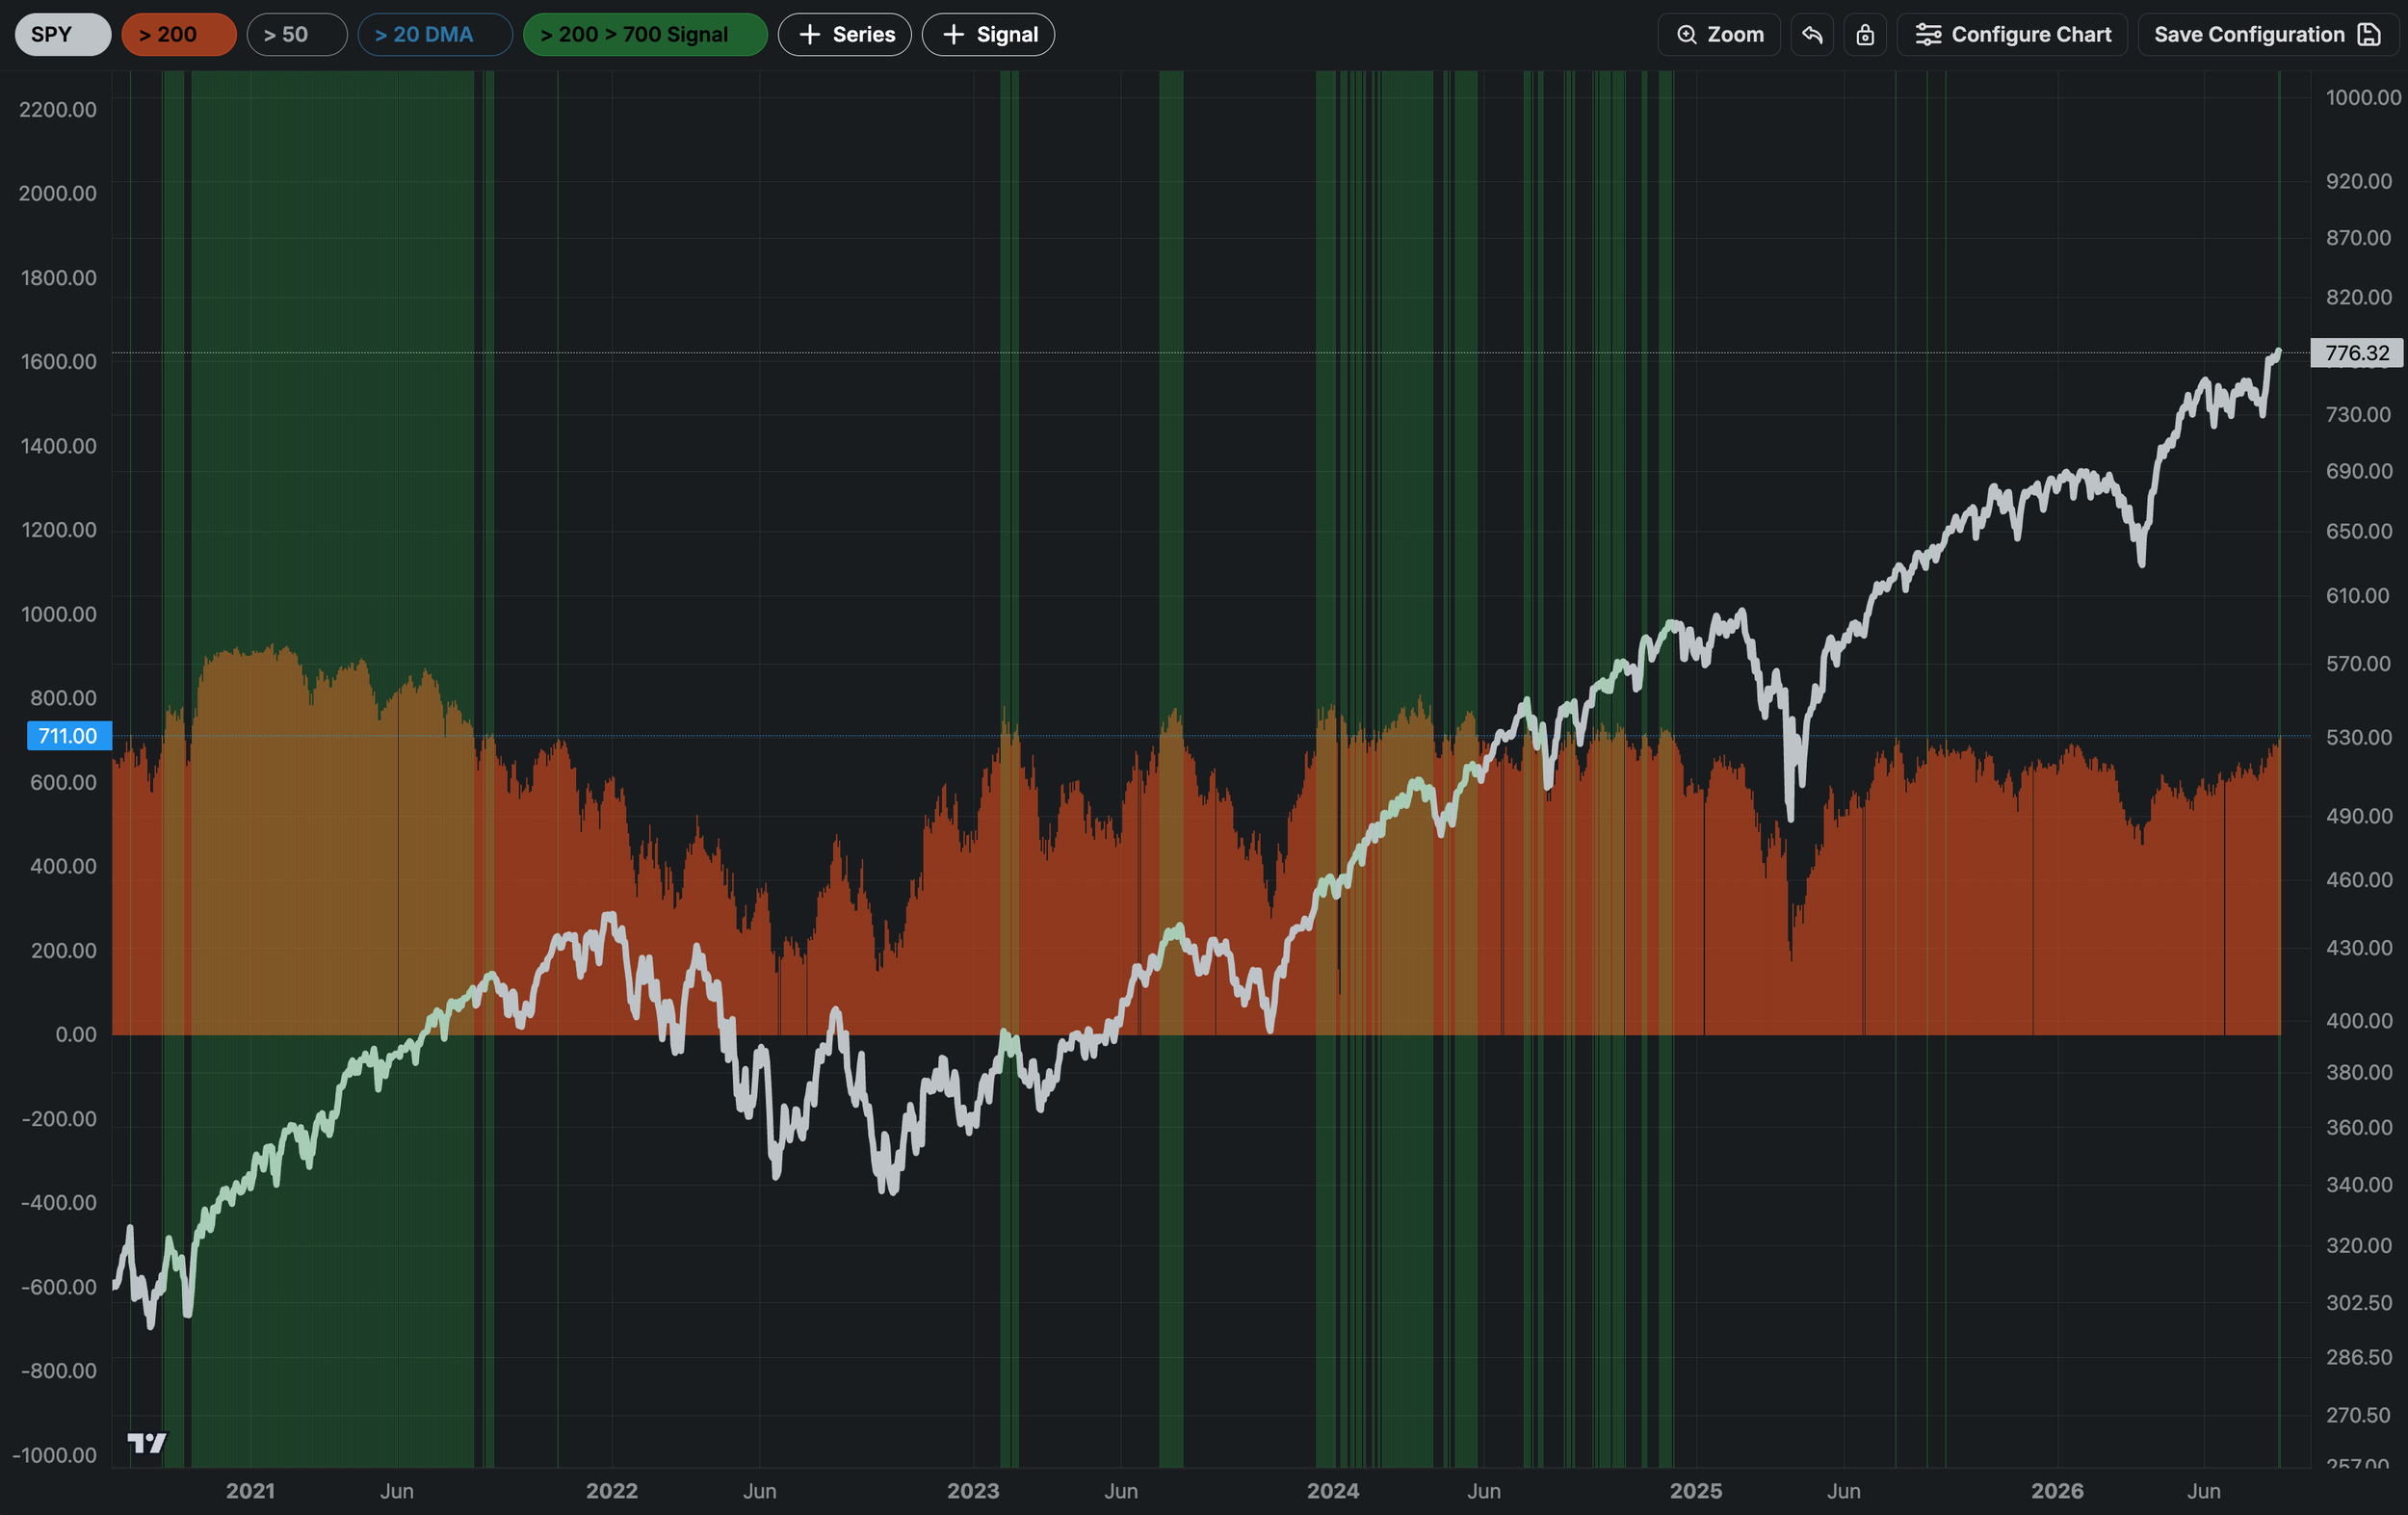
With several sources of buyers simultaneously converging and selling pressure fading, the path of least resistance is higher, not lower. That’s the bull case, at least. Market Breadth has fully healed, with more than 70% of stocks now trading above their 200-DMAs. Historically, this has been a strong bull market indicator, predicting above average outcomes over the next 3, 6 and 12 months, with 80%+ probability of a positive result.
However, data from the options market is sobering, in the sense that long term upside has taken a significant dip, with medium term downside rising to relatively high values. This tells us that the same traders buying cash equities are still paying up for downside protection and reducing upside targets of their call strike prices. Put buying sits near its highest reading since the April recovery.
Our Trading Strategy (Sigma Portfolio)
The bull case is strong and legitimate. A positive outcome over the medium and longer term is indicated by many of our signals, with corporate fundamentals improving. This is not the type of trend that we would like to fight.
However, as indicated by the risk / reward structure currently in play, this is not a fantastic entry point to increase exposure. Instead, we would like to let the market come to us and be patient in the meantime. Our 60% equity exposure is at target with our benchmark, so we have decent participation in any upside.
If the market corrects even slightly in September (as seasonality ahead of midterm elections suggests), we will be buyers on weakness. For now at least, we’ll let winners run and cut losers short, while rotating both the Millennium Alpha and the Vision strategy components.
As usual, we’ll keep you in the loop with our live trading via email.
Disclosures / Disclaimers: This is not a solicitation to buy, sell, or otherwise transact any stock or its derivatives. Nor should it be construed as an endorsement of any particular investment or opinion of the stock’s current or future price. To be clear, I do not encourage or recommend for anyone to follow my lead on this or any other stocks, since I may enter, exit, or reverse a position at any time without notice, regardless of the facts or perceived implications of this blog post. I currently do not own or plan to own any position, long or short, in the securities mentioned.
I am not a financial advisor licensed in the United States. Nor am I providing any recommendations, price targets, or opinions about valuation regarding the companies discussed herein. Any disclosures regarding my holdings are true as of the time this article is written, but subject to change without notice. I frequently trade my positions, often on an intraday basis. Thus, it is possible that I might be buying and/or selling the securities mentioned herein and/or its derivative at any time, regardless of (and possibly contrary to) the content of this blog post.
I undertake no responsibility to update my disclosures and they may therefore be inaccurate thereafter. Likewise, any opinions are as of the date of publication, and are subject to change without notice and may not be updated. I believe that the sources of information I use are accurate but there can be no assurance that they are. All investments carry the risk of loss and the securities mentioned herein may entail a high level of risk. Investors considering an investment should perform their own research and consult with a qualified investment professional.
I wrote this blog post myself, and it expresses my own opinions. I do not have a business relationship with any company whose stock is mentioned in this blog post. The information in this blog post is for informational purposes only and should not be regarded as investment advice or as a recommendation regarding any particular security or course of action.
The primary purpose of this blog post is to share industry expertise and research and receive feedback (confirmation / refutation) regarding my investment theses.