
/ August 10 / Weekly Preview
-
Monday:
N/A
---
Tuesday:
N/A
---
Wednesday:
Core Inflation Rate YoY (2.5% exp.)
Inflation Rate YoY (3.4% exp.)
---
Thursday:
PPI MoM (0.2% exp.)
Initial Jobless Claims (201K exp.)
---
Friday:
Retail Sales MoM (0.2% exp.)
-
Monday:
Simon Property Group, Inc.
---
Tuesday:
Lumentum Holdings Inc.
CoreWeave, Inc.
Super Micro Computer, Inc.
---
Wednesday:
Cisco Systems, Inc.
Nebius Group N.V.
---
Thursday:
Applied Materials, Inc.
Brookfield Corporation
---
Friday:
RLX Technology Inc.
Weak Jobs Data Fuels Breakout
Got a question about the markets, your investments, or a topic you’d like us to discuss in an upcoming article? We read every message and may feature your question in our daily write-ups!
Email: andrei@signal-sigma.com
Follow & DM on X: @signal_sigma
A brief recap of last week would sound like this: “The labor market showed weakness and stocks surged to all time highs as a result.” The S&P 500 ended up +3.6%, with the Nasdaq gaining +5.2% and small caps keeping pace.
After 2 straight weeks of advances, most factors have recovered last month’s drawdown, with the exception of Momentum stocks, which are still lagging. The worst payroll print in years added fuel to the fire and accelerated the surge, on the premise that a September rate hike was taken off the table.
July’s labor report showed more weakness than the headline unemployment rate implies. Payrolls fell by 23,000 versus an expected gain of about 83,000. The unemployment rate ticked down from 4.2% to 4.1%. That decline didn’t come from stronger hiring — it came from a smaller labor force. Labor force participation slipped to 61.4%, down 0.7 percentage points year-to-date, as roughly 1.4 million people simply left the labor force. Taken together, the figures point to falling employment and declining participation, not an improving jobs market.
Normally, a weaker jobs market (which implies a slower economy) should not lead to a risk-on surge in equities. But the markets didn’t care about the longer term implications of the report, only about the future path of interest rates. The Fed held on July 29 by a 9-3 vote, the most divided decision since 2016. With forward guidance now cancelled by Chair Warsh, every data point is shaping expectations in real time. The next rate hike was pushed out to October at the earliest.
On the week, sector leadership was clearly dominated by Tech (XLK), with a +7.2% gain. Other winning sectors include Basic Materials (XLB), benefiting from both an increase in Gold prices as well as copper miner stocks, as well as Transports (XTN) and Consumer Discretionary (XLY). Gold was a quiet winner, up +7.3%, running on the same rate-cut arithmetic that lifted equities. The US Dollar slipped, and volatility god crushed.
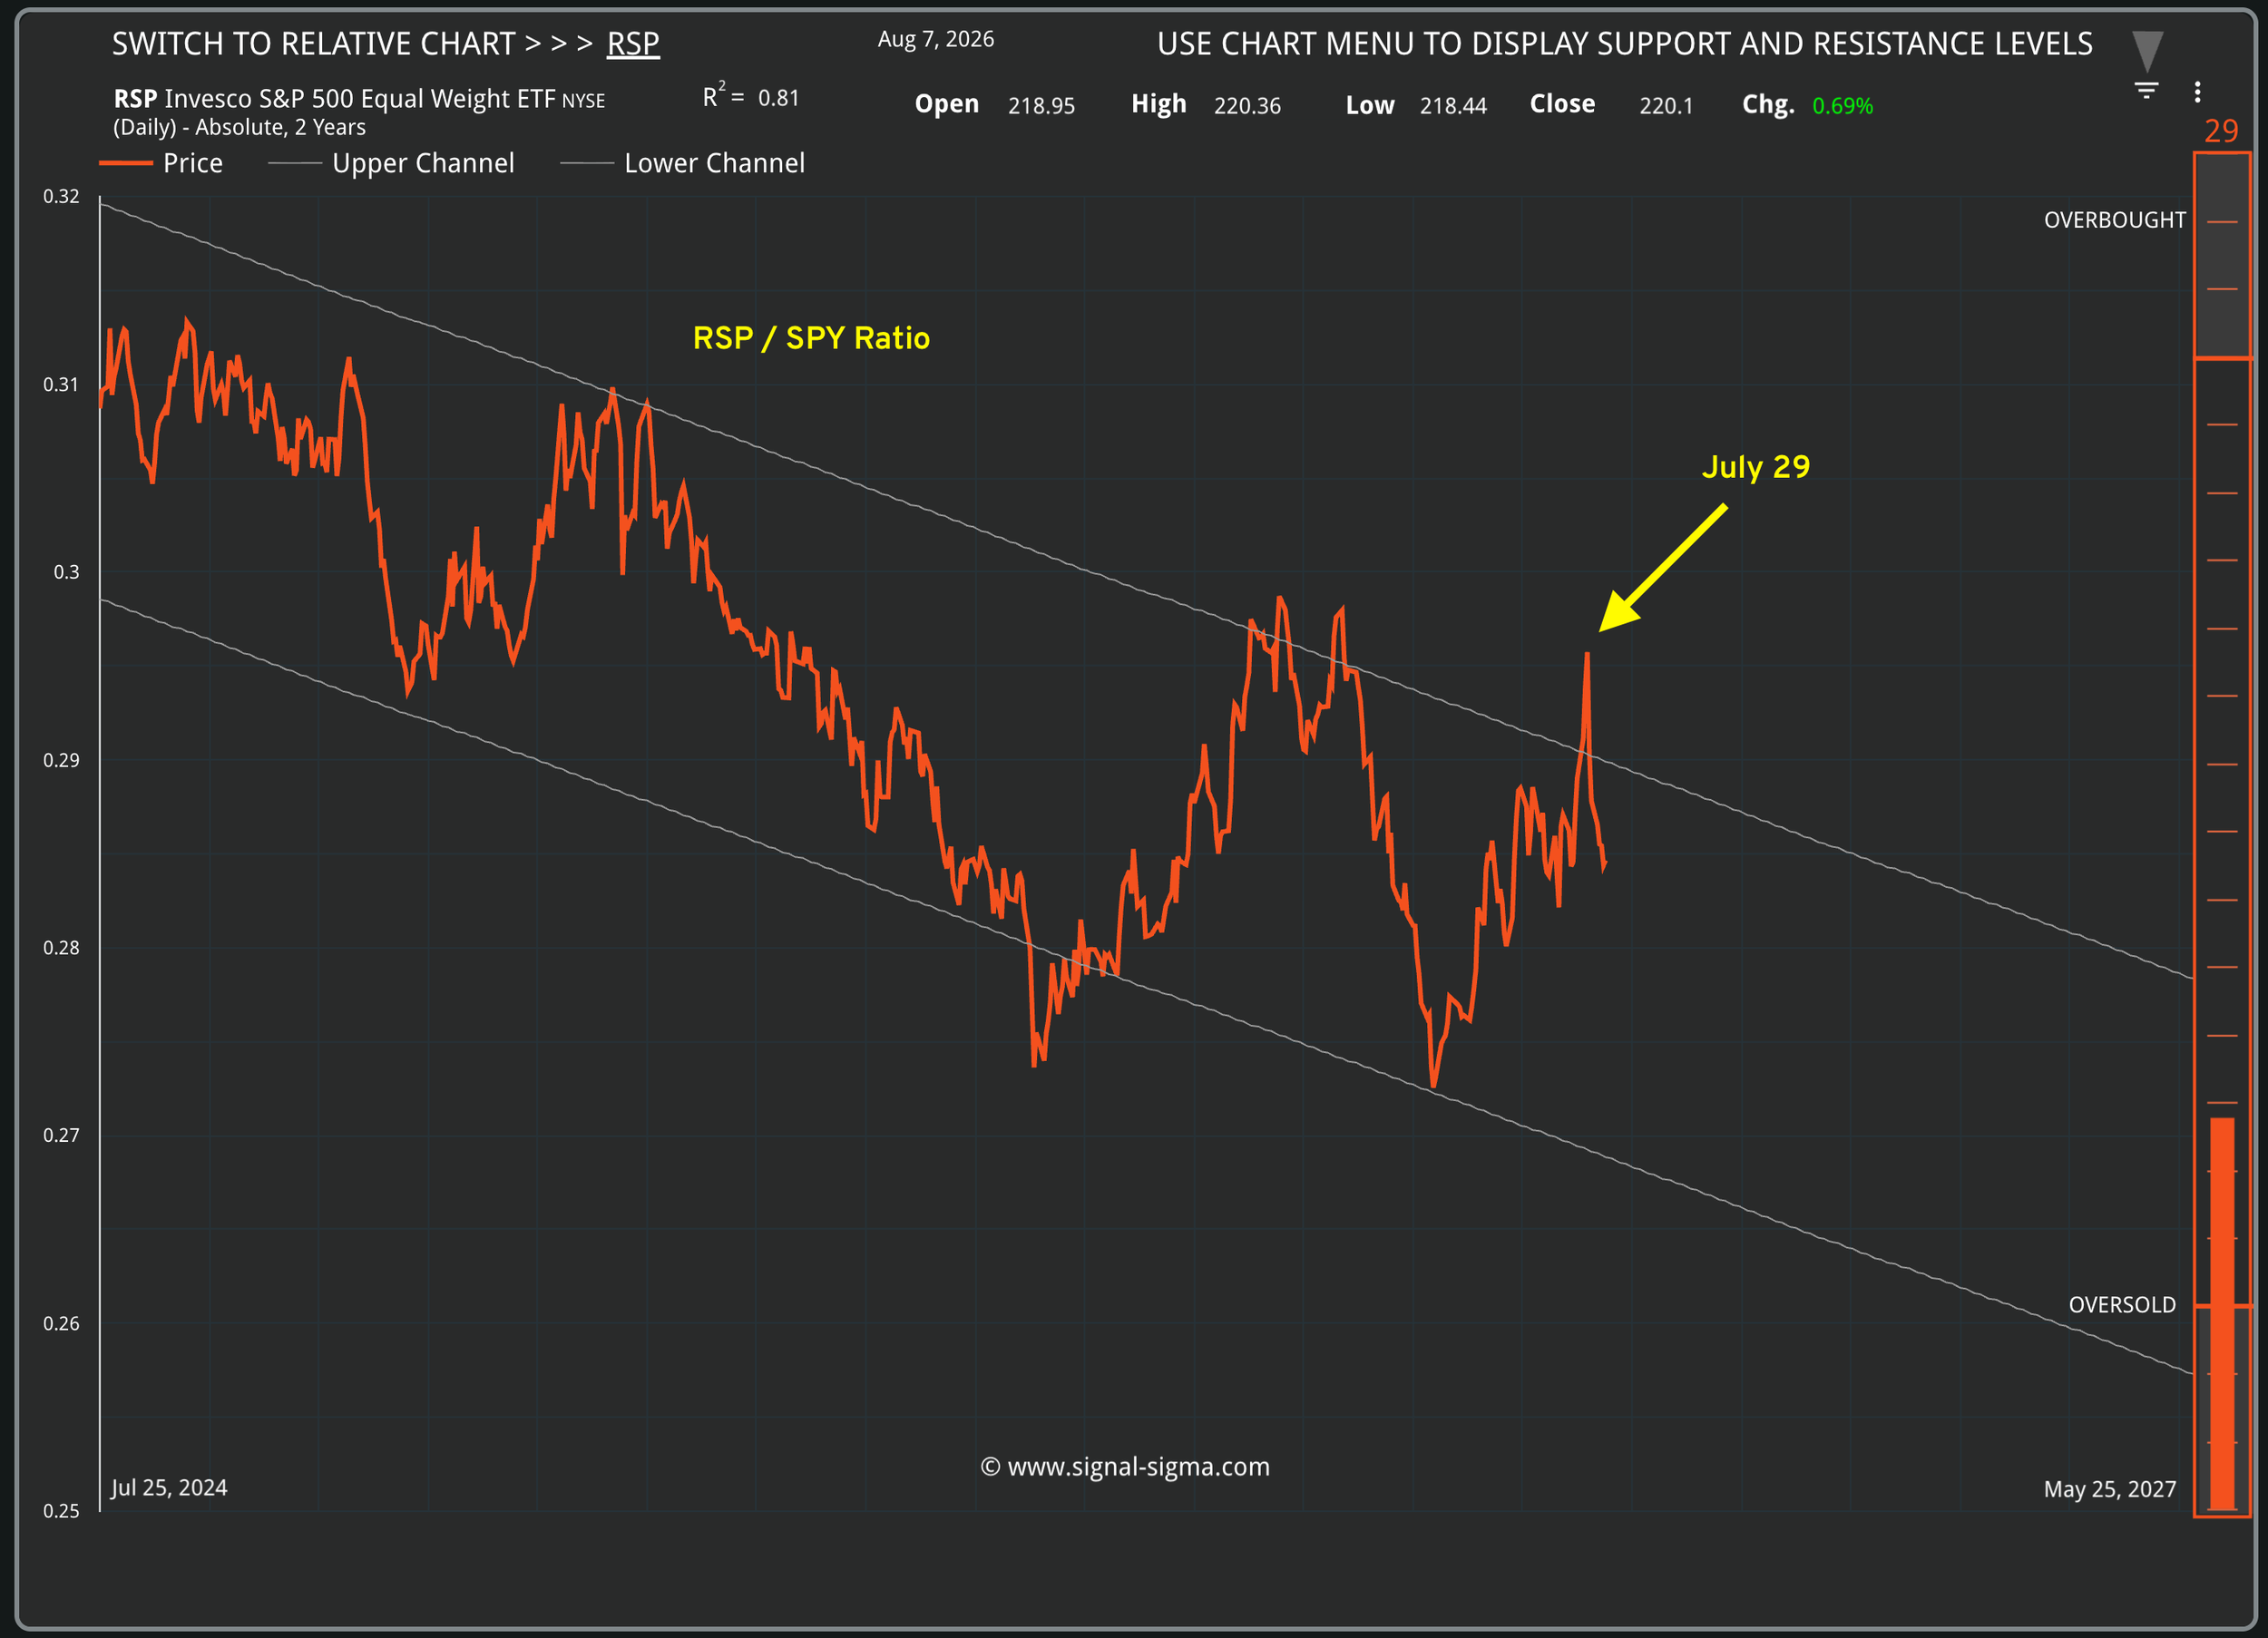
A drop of -9% in crude prices meant Energy (XLE) was the laggard, with traders eyeing renewed Iran diplomacy efforts. Mega Caps also had a good run, with MGK up +5.15%. As a result, the cap-weighted S&P 500 beat its equal-weighted twin by about 115 basis points, reversing the recent trend, just as the RSP / SPY ratio notched a major top on July 29.
Here’s the catch: a softening labor market is only (mildly) bullish if inflation also cooperates. We’ll find out soon enough, with Wednesday’s CPI report. A cool print amid a deteriorated labor market means the Fed will stay still longer. A hot print resurrects the three dissenters who pushed for a July rate hike and forces markets to price in stagflation instead of a soft landing.
It’s not the headline number that really matters, but the core reading. Headline CPI will be pulled lower by energy after crude dropped almost 9%, which makes the headline look better for reasons unrelated to actual price pressures. The true signal is in shelter and services, which show up in the core reading.
PPI is reported Thursday and retail sales on Friday. Together they show whether consumers keep spending as employment contracts. We’ll focus less on the headline figures and more on the control group in retail sales, since it feeds into GDP.
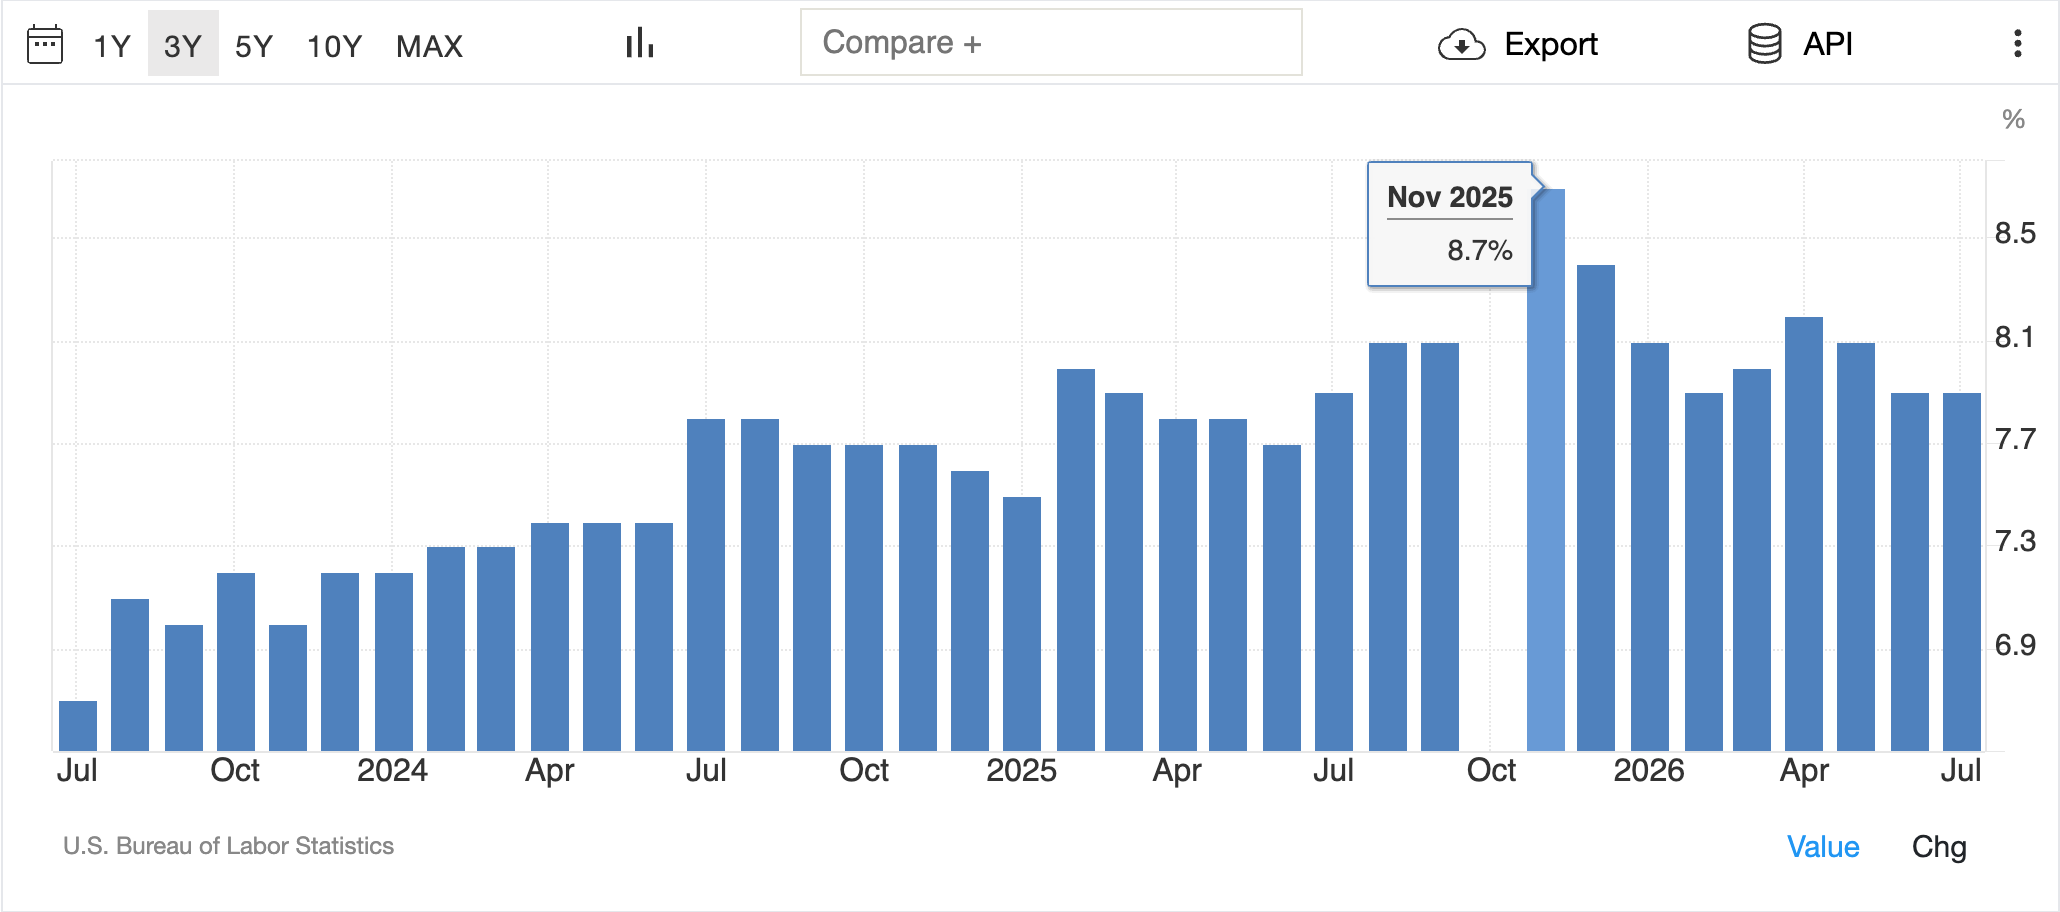
Weekly jobless claims Thursday are more important than usual — a second soft labor report in the same week would strengthen the view that July’s weakness reflects a trend rather than a one-off. The overall trend appears strong from November 2025 to present, with both continuing + initial claims as well as the unemployment rate headed lower. Even accounting for a lower participation rate, (U6 unemployment, chart below), the labor market pivot still appears to be November 2025.
The technical backdrop continues to hold up well. Both the daily and the weekly MACD signals are positive, with SPY hovering about +10% above its rising 200-DMA. The medium term stochastic reading is overbought, but that’s always the case at all-time-highs. The trading channel is now sloping positive with a 18.3% CAGR and accelerating.
The overall pattern is more important than support and resistance levels right now. Since early June the market hasn’t really declined. It’s traded sideways. That distinction matters because an overbought market corrects in one of two ways: a sudden price drop or a gradual consolidation.
This time, the market has consolidated. Eight weeks of choppy action reset momentum without breaking the uptrend. Tuesday’s record close at 7,736 showed buyers had absorbed overhead supply, and Friday’s jobs-driven surge (also confirmed by volume) reinforced the move. This is what we would call a “real breakout” rather than just a “short squeeze”.
At record high levels, the natural question becomes whether it makes sense to chase the rally. Historical data argues against fear, especially when the breakout occurs out of a low 3-Month returns episode. Unless we are now standing at the precipice of another tariff style correction, the odds of a positive outcome are higher than 70% at every time interval from 2 weeks out up to 1 year out.
Furthermore, according to Carson Group, since 2016, the worst 1-Year outcome after such an event was -2.8%. Conclusion: new highs signal further highs far more frequently than they signal a market peak.
Of course, the chorus of bears is still going strong, emboldened by some pretty bearish action during the past month. Scott Rubner’s team at Citadel Securities monitors retail order flow and their findings are quite astonishing for the month of July.
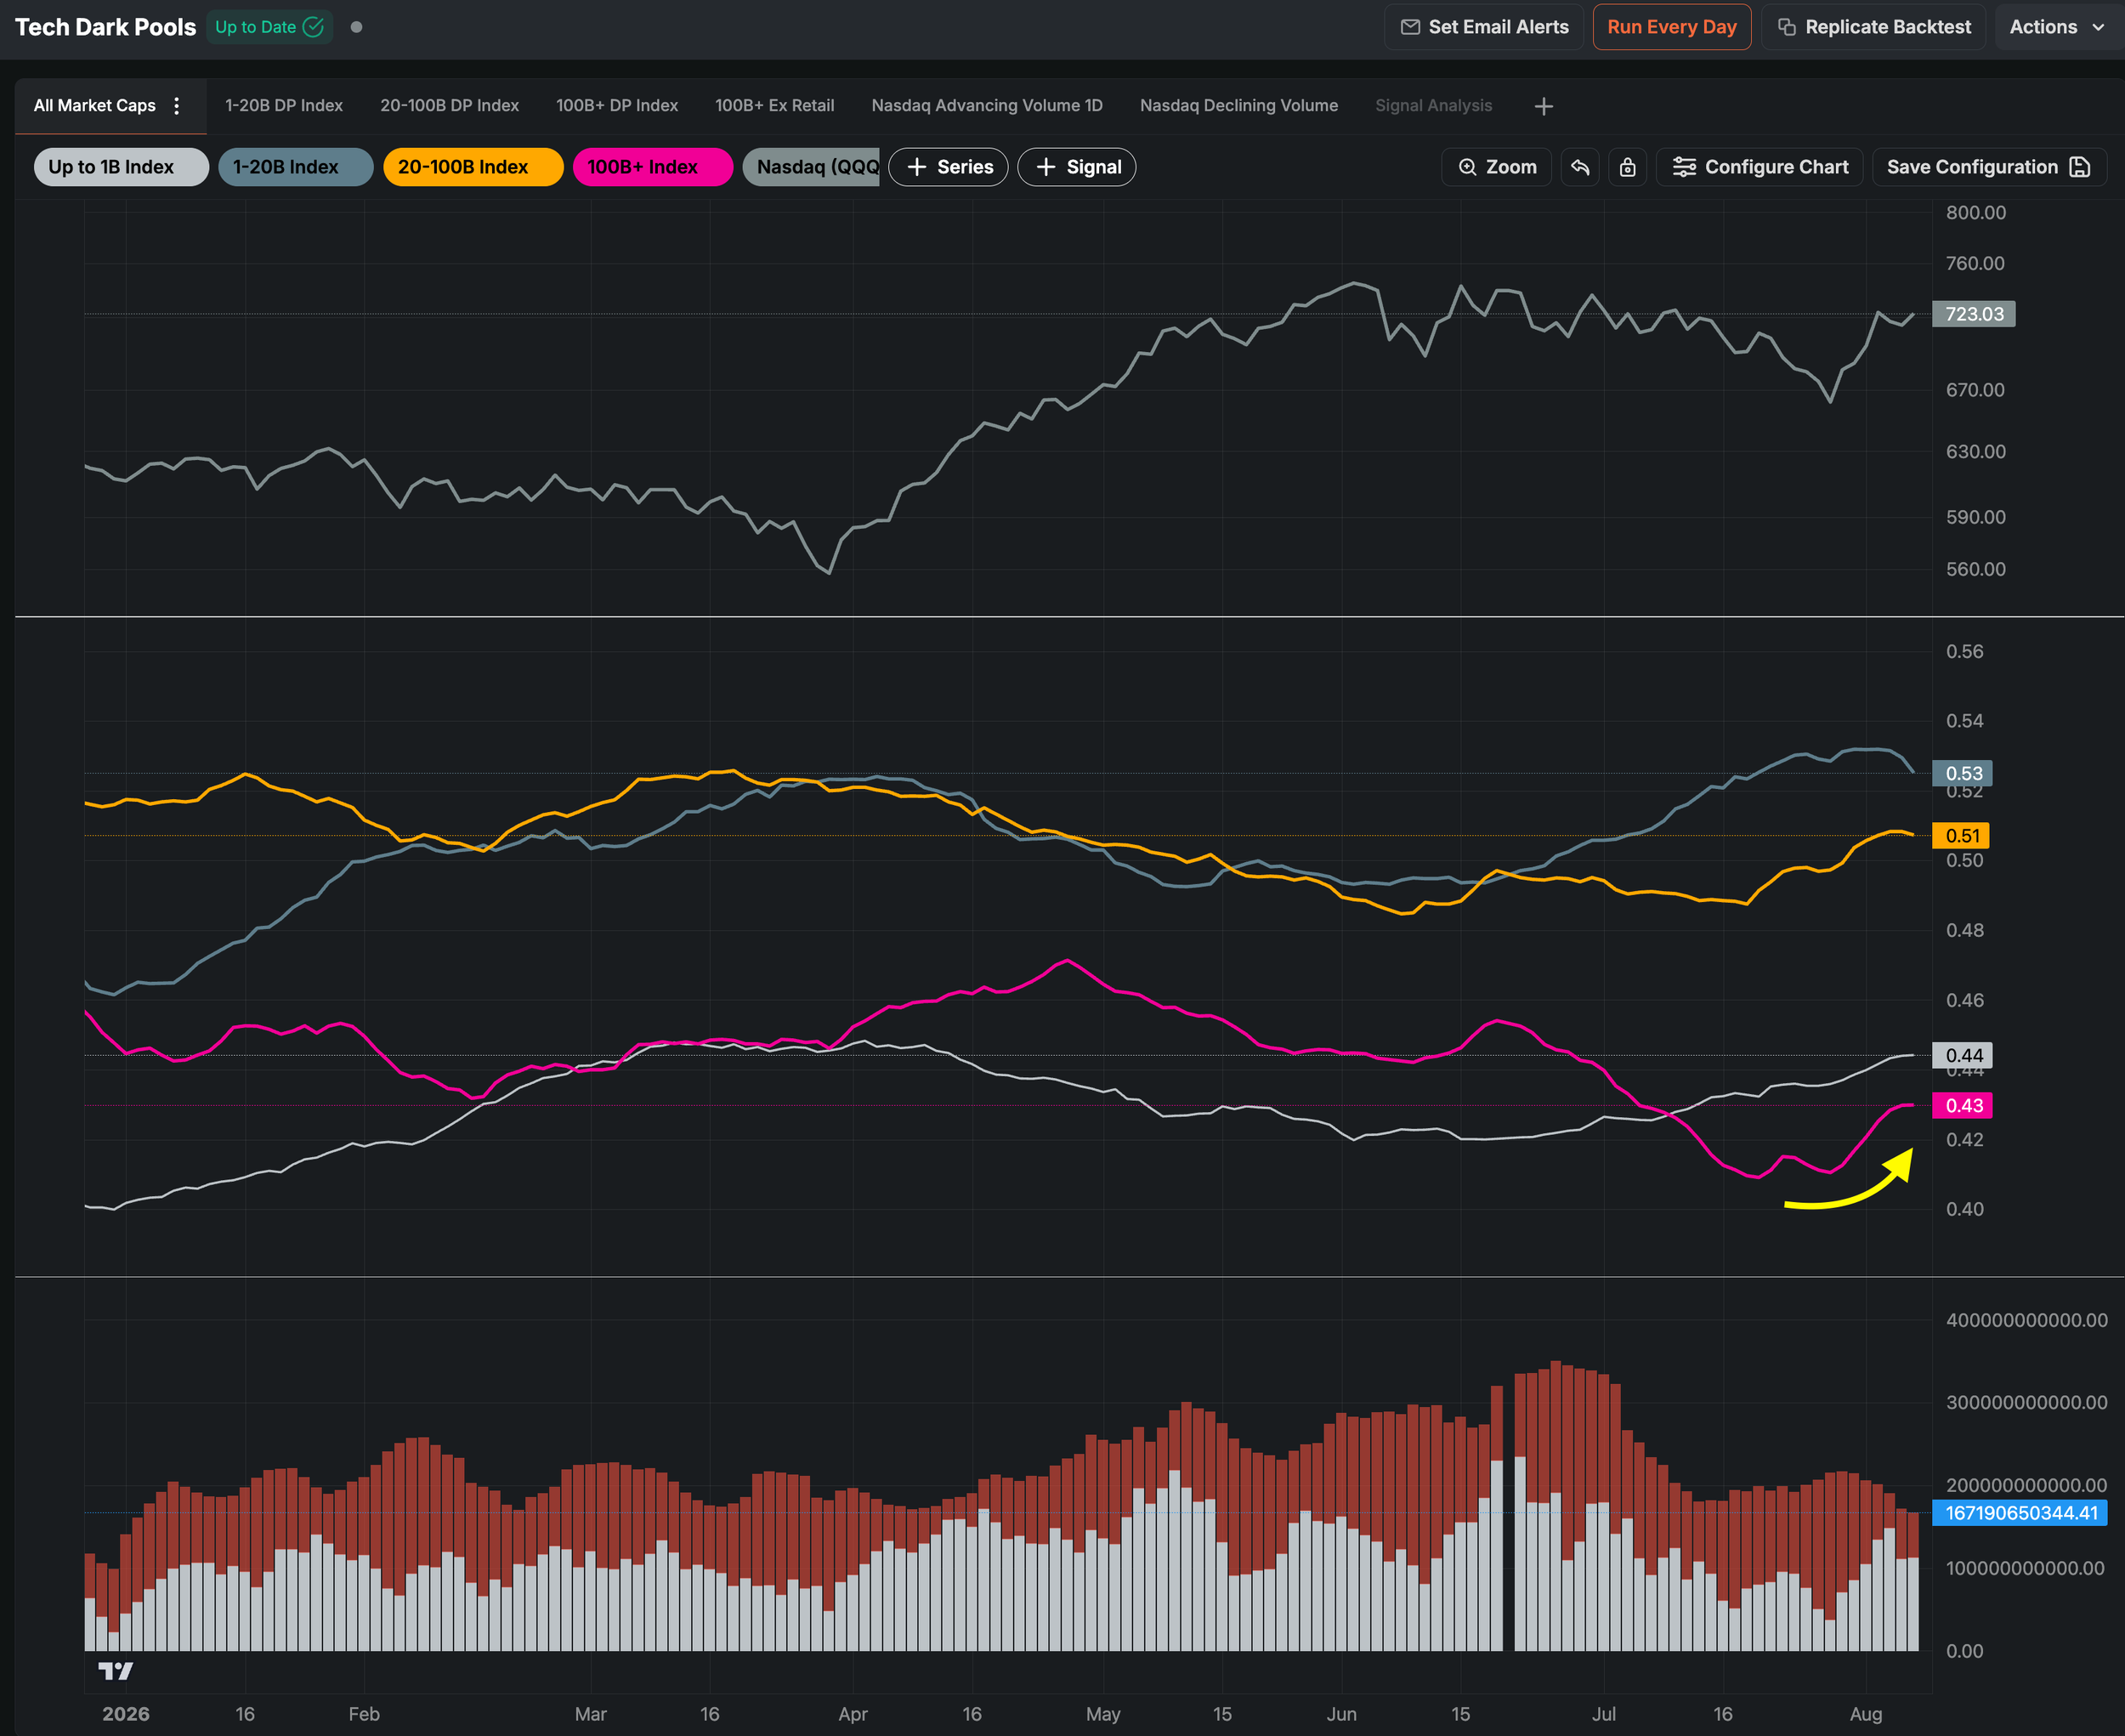
Retail investors executed a dramatic wave of selling concentrated in technology, especially semiconductors and memory stocks that they had been accumulating most aggressively earlier in May and June. The final week of the month produced the largest retail Technology selling week in the firm’s dataset going back to January 2019, exceeding the prior record by more than 80 percent.
Average daily net selling in those semiconductor and memory names ran more than five times the previous record, and two of the three largest retail Tech sell days ever observed occurred inside that single week. Software also saw its largest one-day retail liquidation on record. Overall retail equity selling that week was on pace for the biggest weekly total since 2022, with net selling in every session and average daily notional volume nearly twice the November 2025 episode.
Alongside the cash equity liquidation, leveraged ETF assets fell more than $60 billion from their June peak, with technology-related products down roughly 40 percent and semiconductors down nearly 55 percent in a month.
In contrast, institutional investors in the tech sector continued strong accumulation or reversed distribution trends, just as selling became more pronounced at the end of July.
The claim of AI bears that spending was decoupling from demand simply had no fundamental grounds. For example, Microsoft’s remaining commercial performance obligations stood at $678 billion. Alphabet’s cloud backlog was $514 billion. Amazon’s amounted to $496 billion. Combined, the four largest hyperscalers hold about $1.688 trillion in contracted revenue versus roughly $725 billion in projected 2026 capital expenditures.
The contracted backlog is 2.3× the spending it needs to justify and has a short duration. Microsoft’s weighted-average contract duration is 2.3 years, with the portion converting within 12 months up 37% year-over-year. Alphabet expects to recognize just over half of its backlog within 24 months.
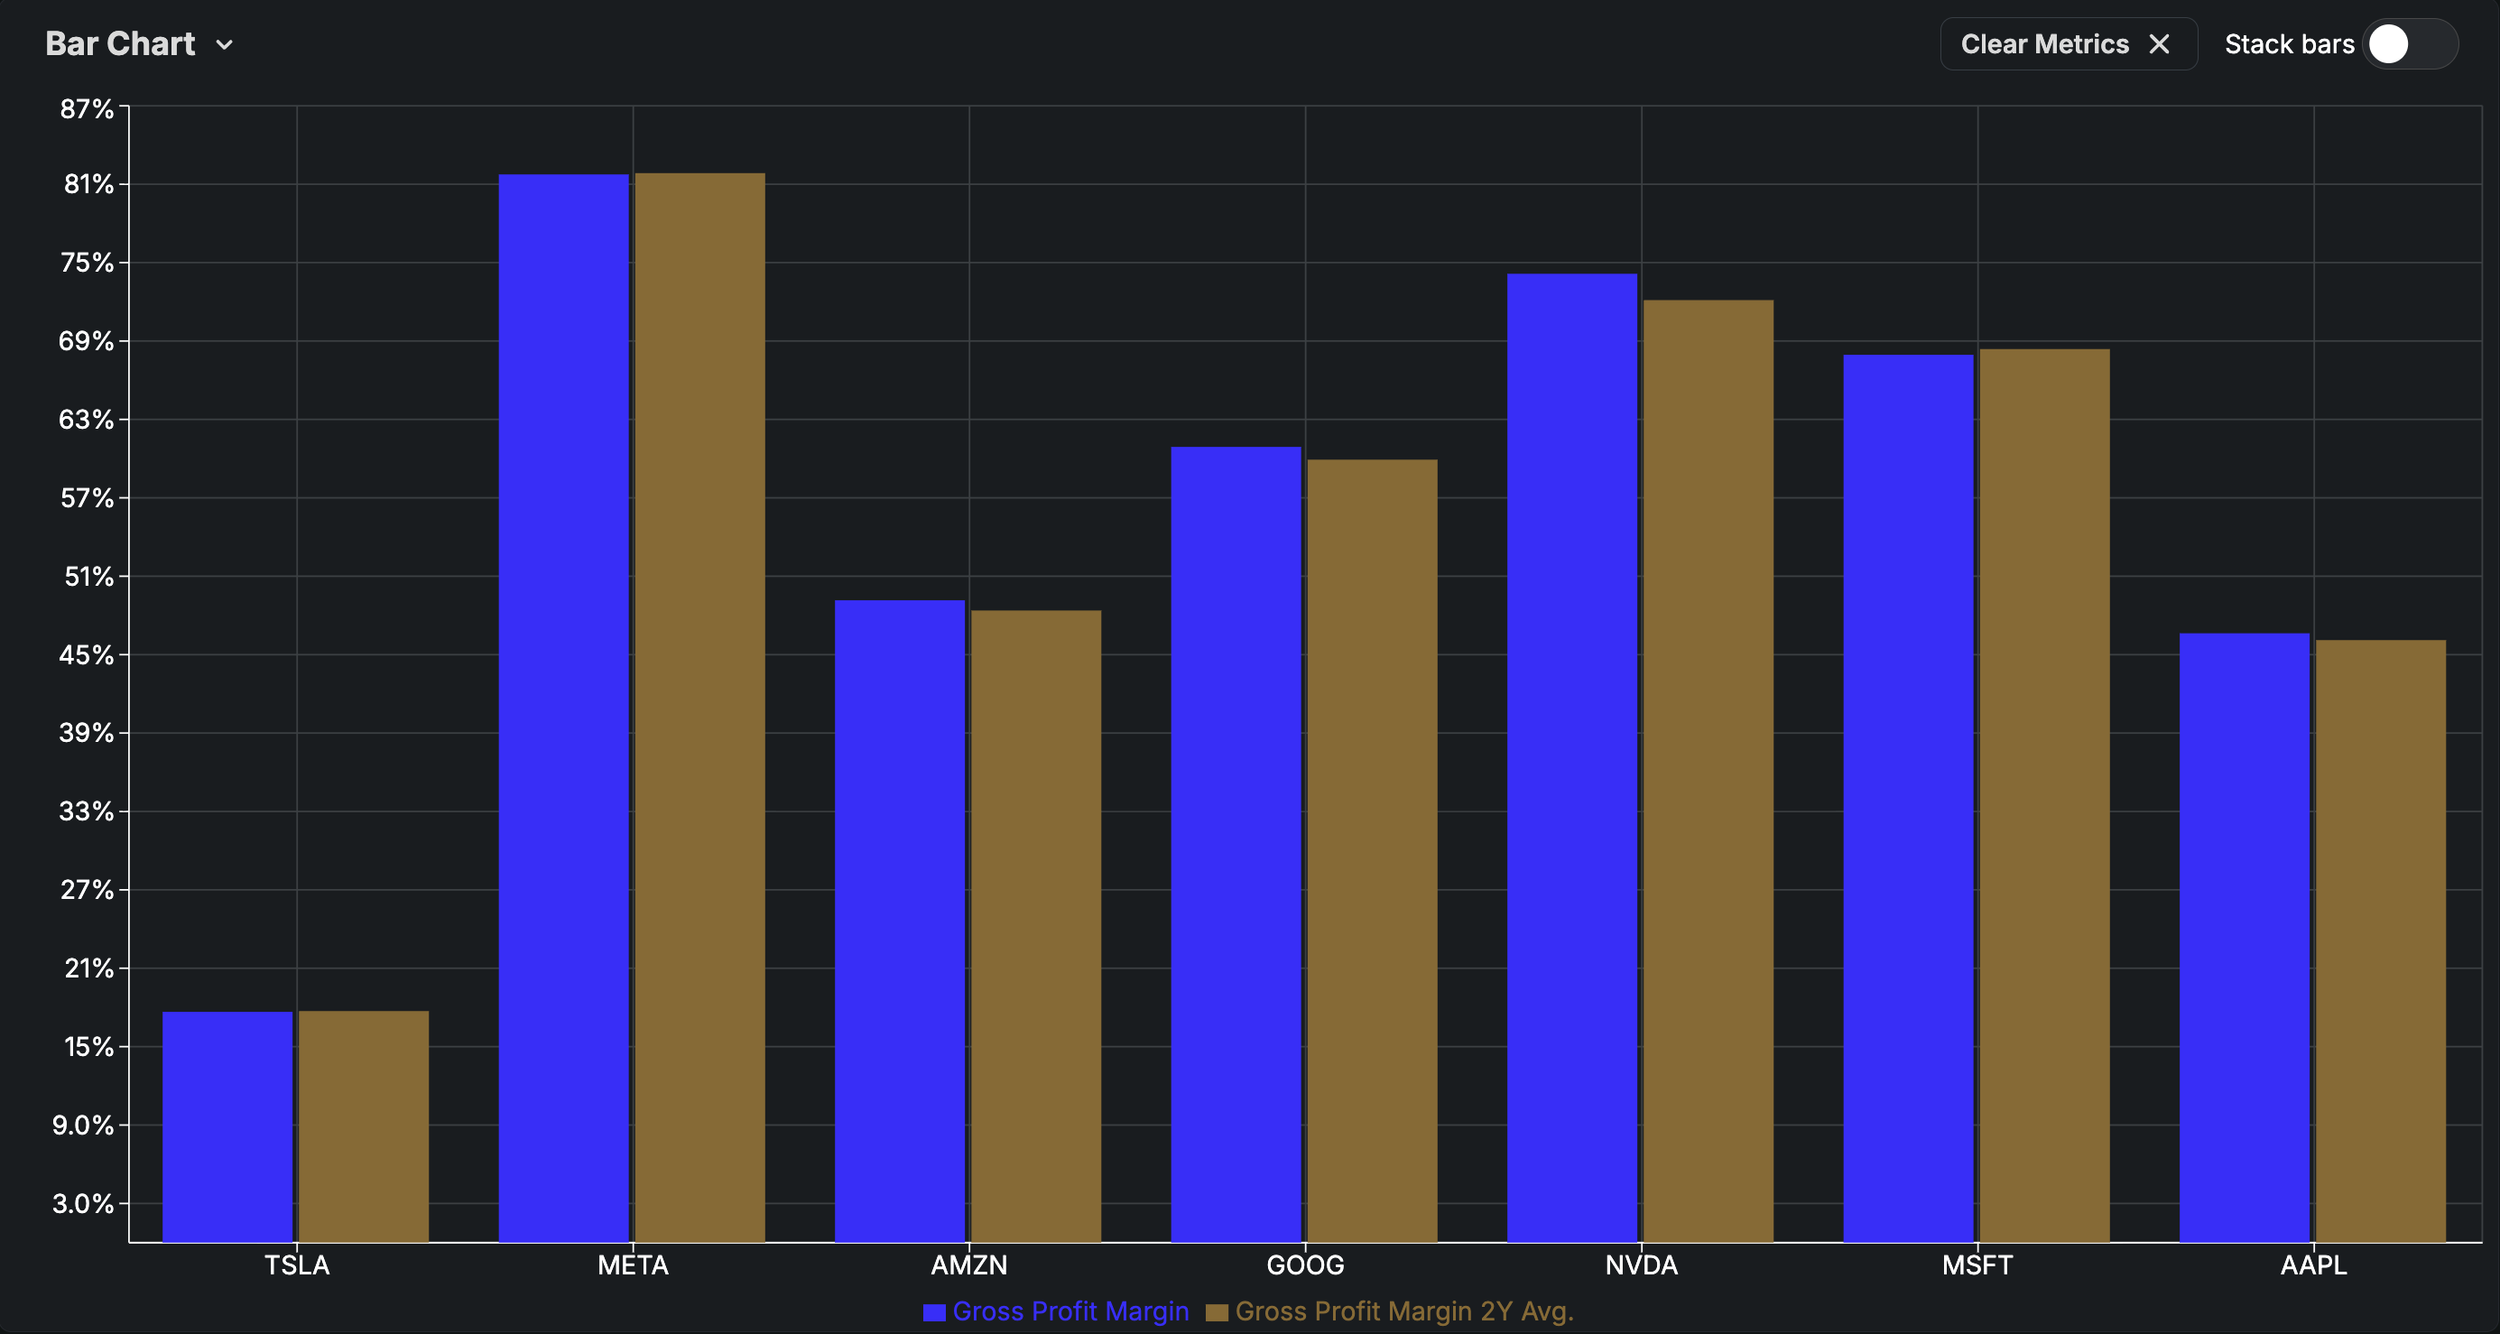
If AI workloads carried structurally worse economics, we would see gross margins compress across Mag-7 stocks. Instead, we’re looking at stable or expanding gross margins compared to the 2-Year average. Furthermore, the entire S&P 500’s gross margin now sits at 44%, a historically high number.
Our Trading Strategy (Sigma Portfolio)
Our automated stock picking models significantly underperformed during the month of July, as positioning was concentrated exactly in the areas where selling was most pronounced. The fundamental story remains intact, however. Vision is now back to all time highs.
Citadel’s read echoes our own thoughts: positioning has normalized, fundamentals are once again relevant, leverage has been reduced, and funding spreads have tightened to about 50 basis points over SOFR, down from a peak of 138 basis points. Tech trades at a discount to its 10-year average when taking growth into account. In fact, the market is actively overlooking one of the cheapest PEG ratios for the S&P 500 ever recorded (below 1.0 as of month start).
If inflation confirms our suspicions (comes in cool), yields should compress. All else being equal, cheaper money helps long-duration assets. Furthermore, starting mid-August, the corporate buyback machine starts revving up again, putting a floor under potential losses.
We would not hurry to rebalance portfolio positions at the moment. Rather, exposure can be added on a pullback that does not violate support. We would favor stock picks from both Millennium Alpha and Vision strategies. Furthermore, tomorrow’s rebalance of the Enterprise strategy will shed more light on the asset allocation mix that our system is using.
Disclosures / Disclaimers: This is not a solicitation to buy, sell, or otherwise transact any stock or its derivatives. Nor should it be construed as an endorsement of any particular investment or opinion of the stock’s current or future price. To be clear, I do not encourage or recommend for anyone to follow my lead on this or any other stocks, since I may enter, exit, or reverse a position at any time without notice, regardless of the facts or perceived implications of this blog post. I currently do not own or plan to own any position, long or short, in the securities mentioned.
I am not a financial advisor licensed in the United States. Nor am I providing any recommendations, price targets, or opinions about valuation regarding the companies discussed herein. Any disclosures regarding my holdings are true as of the time this article is written, but subject to change without notice. I frequently trade my positions, often on an intraday basis. Thus, it is possible that I might be buying and/or selling the securities mentioned herein and/or its derivative at any time, regardless of (and possibly contrary to) the content of this blog post.
I undertake no responsibility to update my disclosures and they may therefore be inaccurate thereafter. Likewise, any opinions are as of the date of publication, and are subject to change without notice and may not be updated. I believe that the sources of information I use are accurate but there can be no assurance that they are. All investments carry the risk of loss and the securities mentioned herein may entail a high level of risk. Investors considering an investment should perform their own research and consult with a qualified investment professional.
I wrote this blog post myself, and it expresses my own opinions. I do not have a business relationship with any company whose stock is mentioned in this blog post. The information in this blog post is for informational purposes only and should not be regarded as investment advice or as a recommendation regarding any particular security or course of action.
The primary purpose of this blog post is to share industry expertise and research and receive feedback (confirmation / refutation) regarding my investment theses.