
Capitulation?
Got a question about the markets, your investments, or a topic you’d like us to discuss in an upcoming article? We read every message and may feature your question in our daily write-ups!
Email: andrei@signal-sigma.com
Follow & DM on X: @signal_sigma
The S&P 500 dropped -8.6% to close at 6,910, extending its losing streak to seven sessions in the longest run of declines since February 2020. No other market index was spared. The Nasdaq-100 fell -10.4%, the Dow declined -8.0%, and the Russell 2000 lost -7.5%. Now, -11.6% below its October 6 record high, the S&P 500 is officially in correction territory, while the VIX nearly doubled to 37.
All sector ETFs that we track fell during the week, with Staples (XLP) posting the lowest decline at -2.02%. Tech (XLK) led to the downside with a -12% drop.
Weekly Sector Returns
The question we’ll attempt to answer in this article is whether we’re dealing with a mechanical liquidation event or a more meaningful deterioration of fundamentals (possibly a credit-related event) which would end the current bull market.
First off — the liquidation side. There was definitely mechanical selling during the week, as Goldman’s Rich Privorotsky noted: “Dealers were heavily short gamma into Friday’s monthly options expiration, which fed the afternoon selling.” Anthropic’s IPO did not help, as investors had to dump other assets in order to make room for this allocation. Gold fell -9.5% and Bitcoin broke below $60.000 as a potential consequence of margin calls.
On the macro side, Fed Governor Christopher Waller called for a 50-basis-point rate increase at the December 8-9 meeting following a third consecutive 0.3% monthly rise in core CPI. On Thursday, the Commerce Department’s restriction on Chinese companies’ remote access to advanced AI chips went into effect, hitting the AI supply chain the same day. At the same time, the 10-year Treasury yield declined to 4.91% from 5.15%.
The bond market is beginning to price in a growth slowdown, while the Fed is focused on combating inflation.
So… the real question investors are asking: have any of the fundamentals actually changed?
According to FactSet, for Q3 2026, the blended (year-over-year) earnings growth rate for the S&P 500 is 32.9%. During the quarter, 36 S&P 500 companies have issued negative EPS guidance and 46 S&P 500 companies have issued positive EPS guidance. Analysts had raised fourth-quarter EPS estimates 1.1% since September 30.
The forward 12-month P/E ratio for the S&P 500 is 17.1, below both the 5-year average (19.8) and the 10-year average (19.1).
The Atlanta Fed’s GDPNow model shows fourth-quarter growth at 3.2%.
The level of initial + continuing claims jumped to nearly 2M, but remains near historic lows.
Now for the bearish insights:
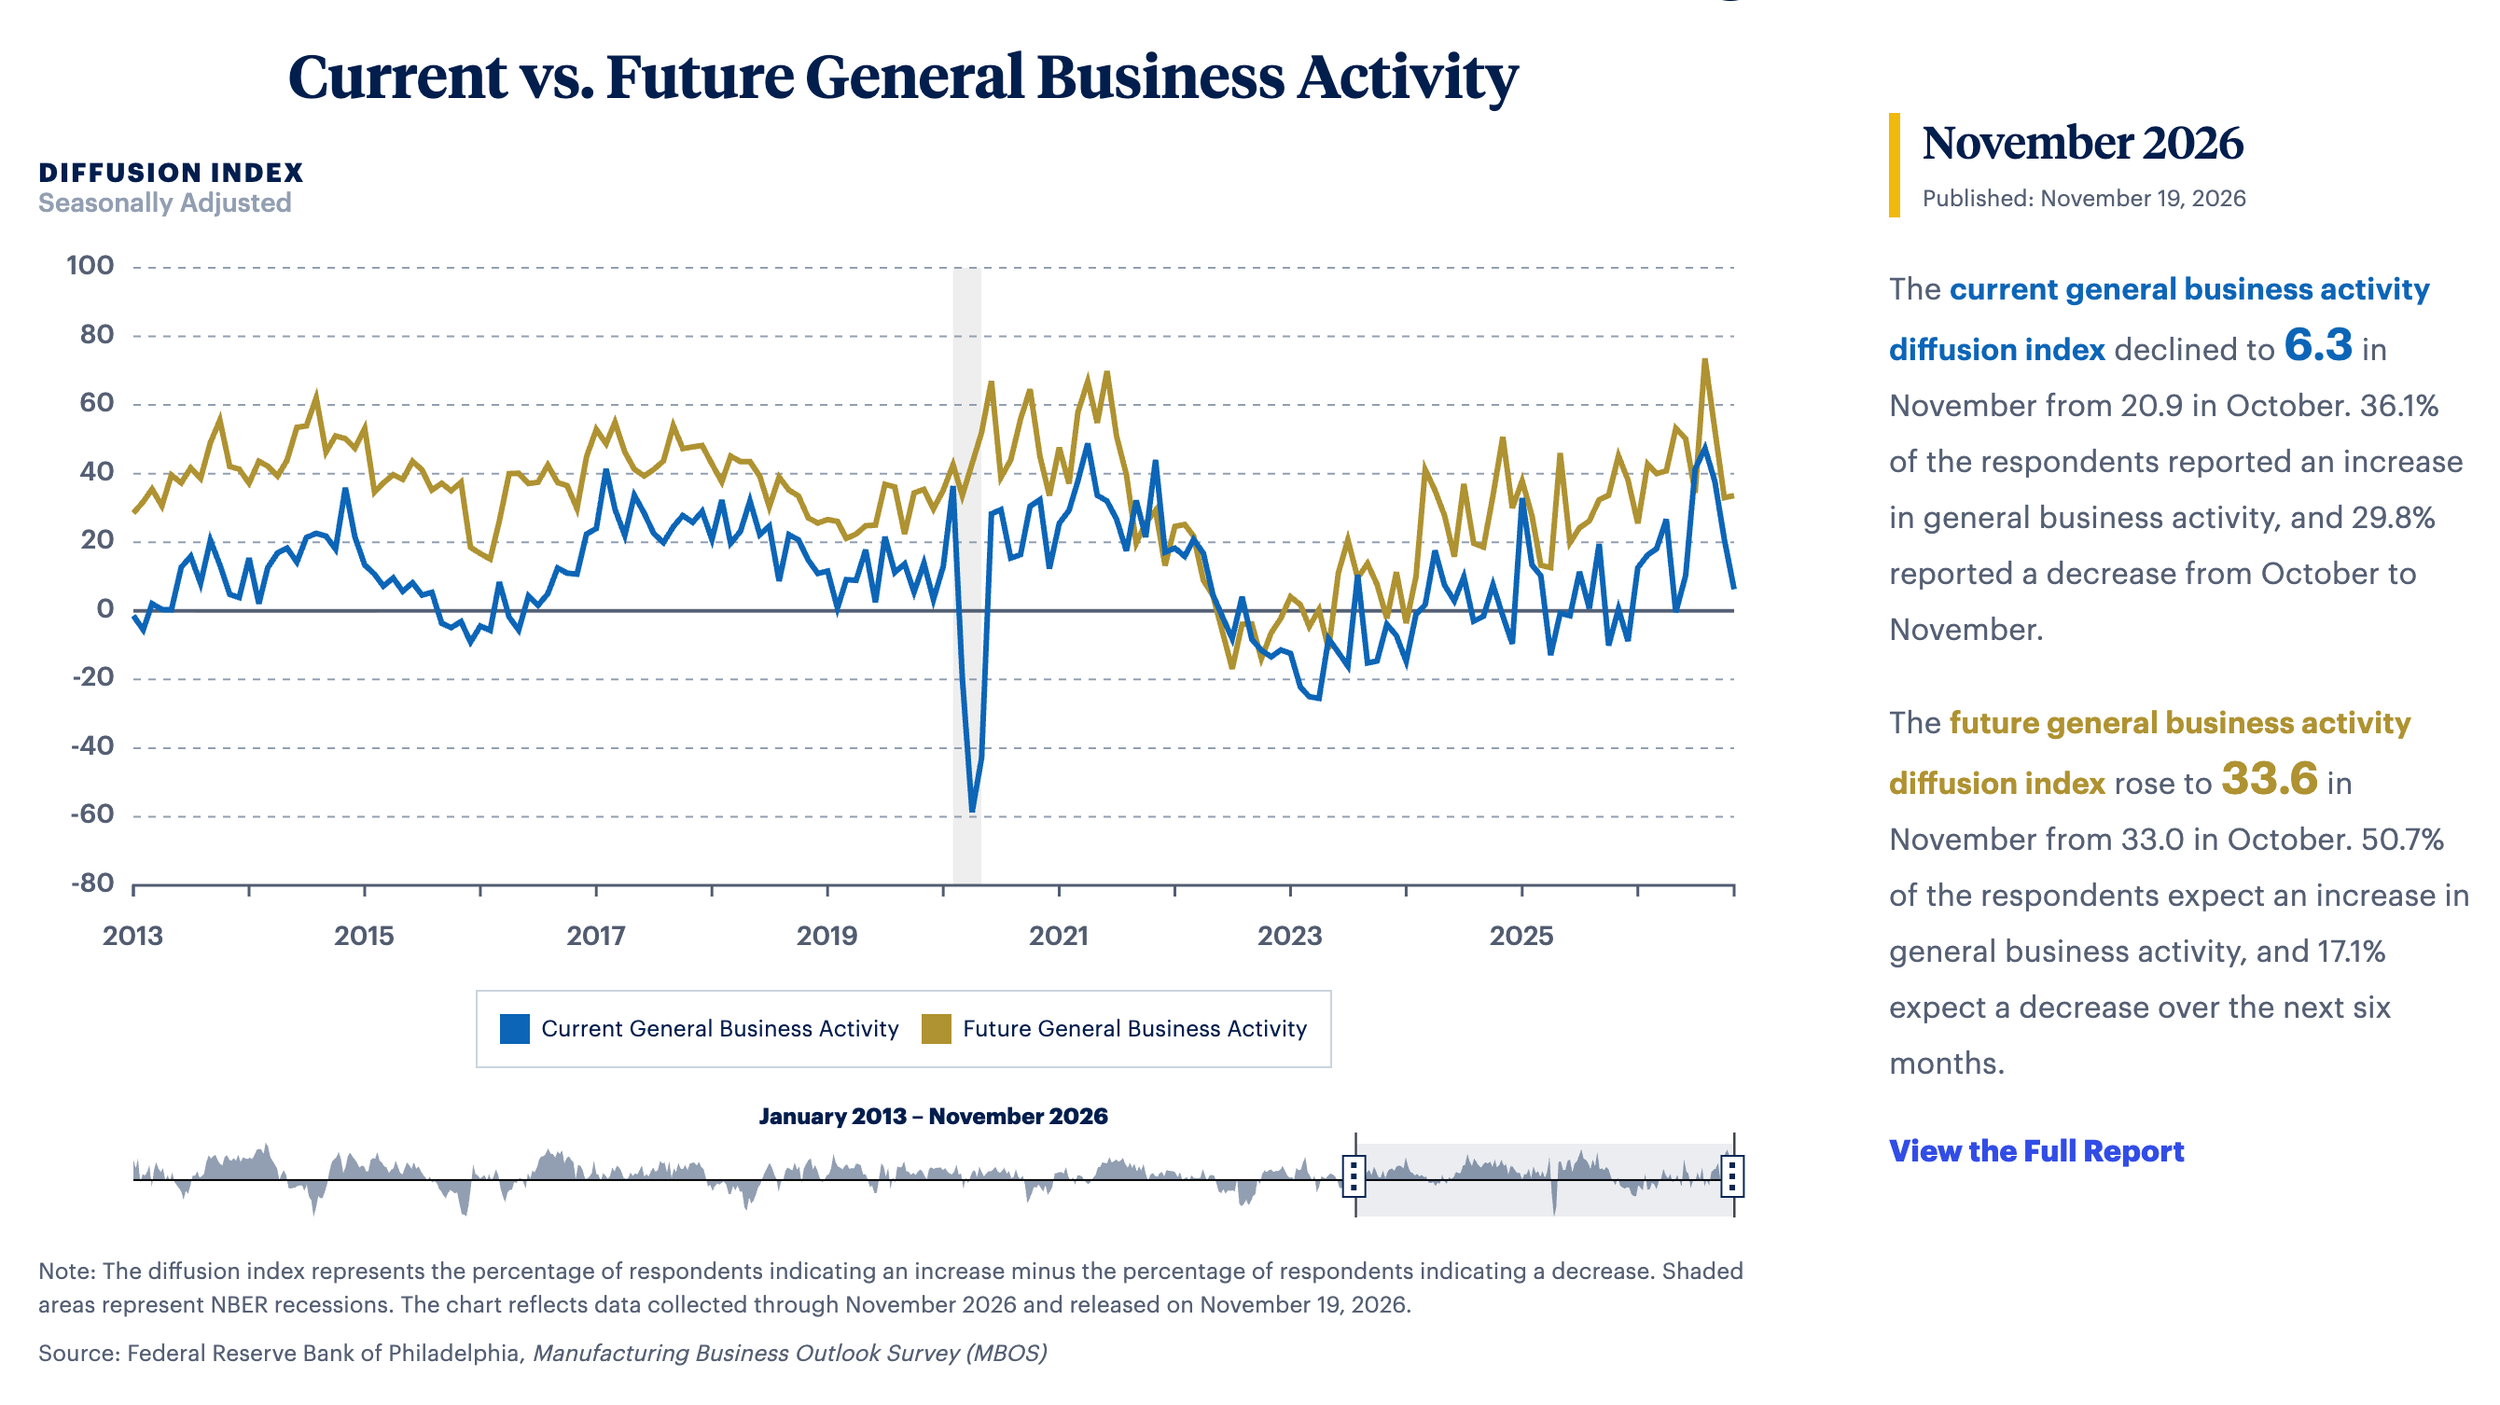
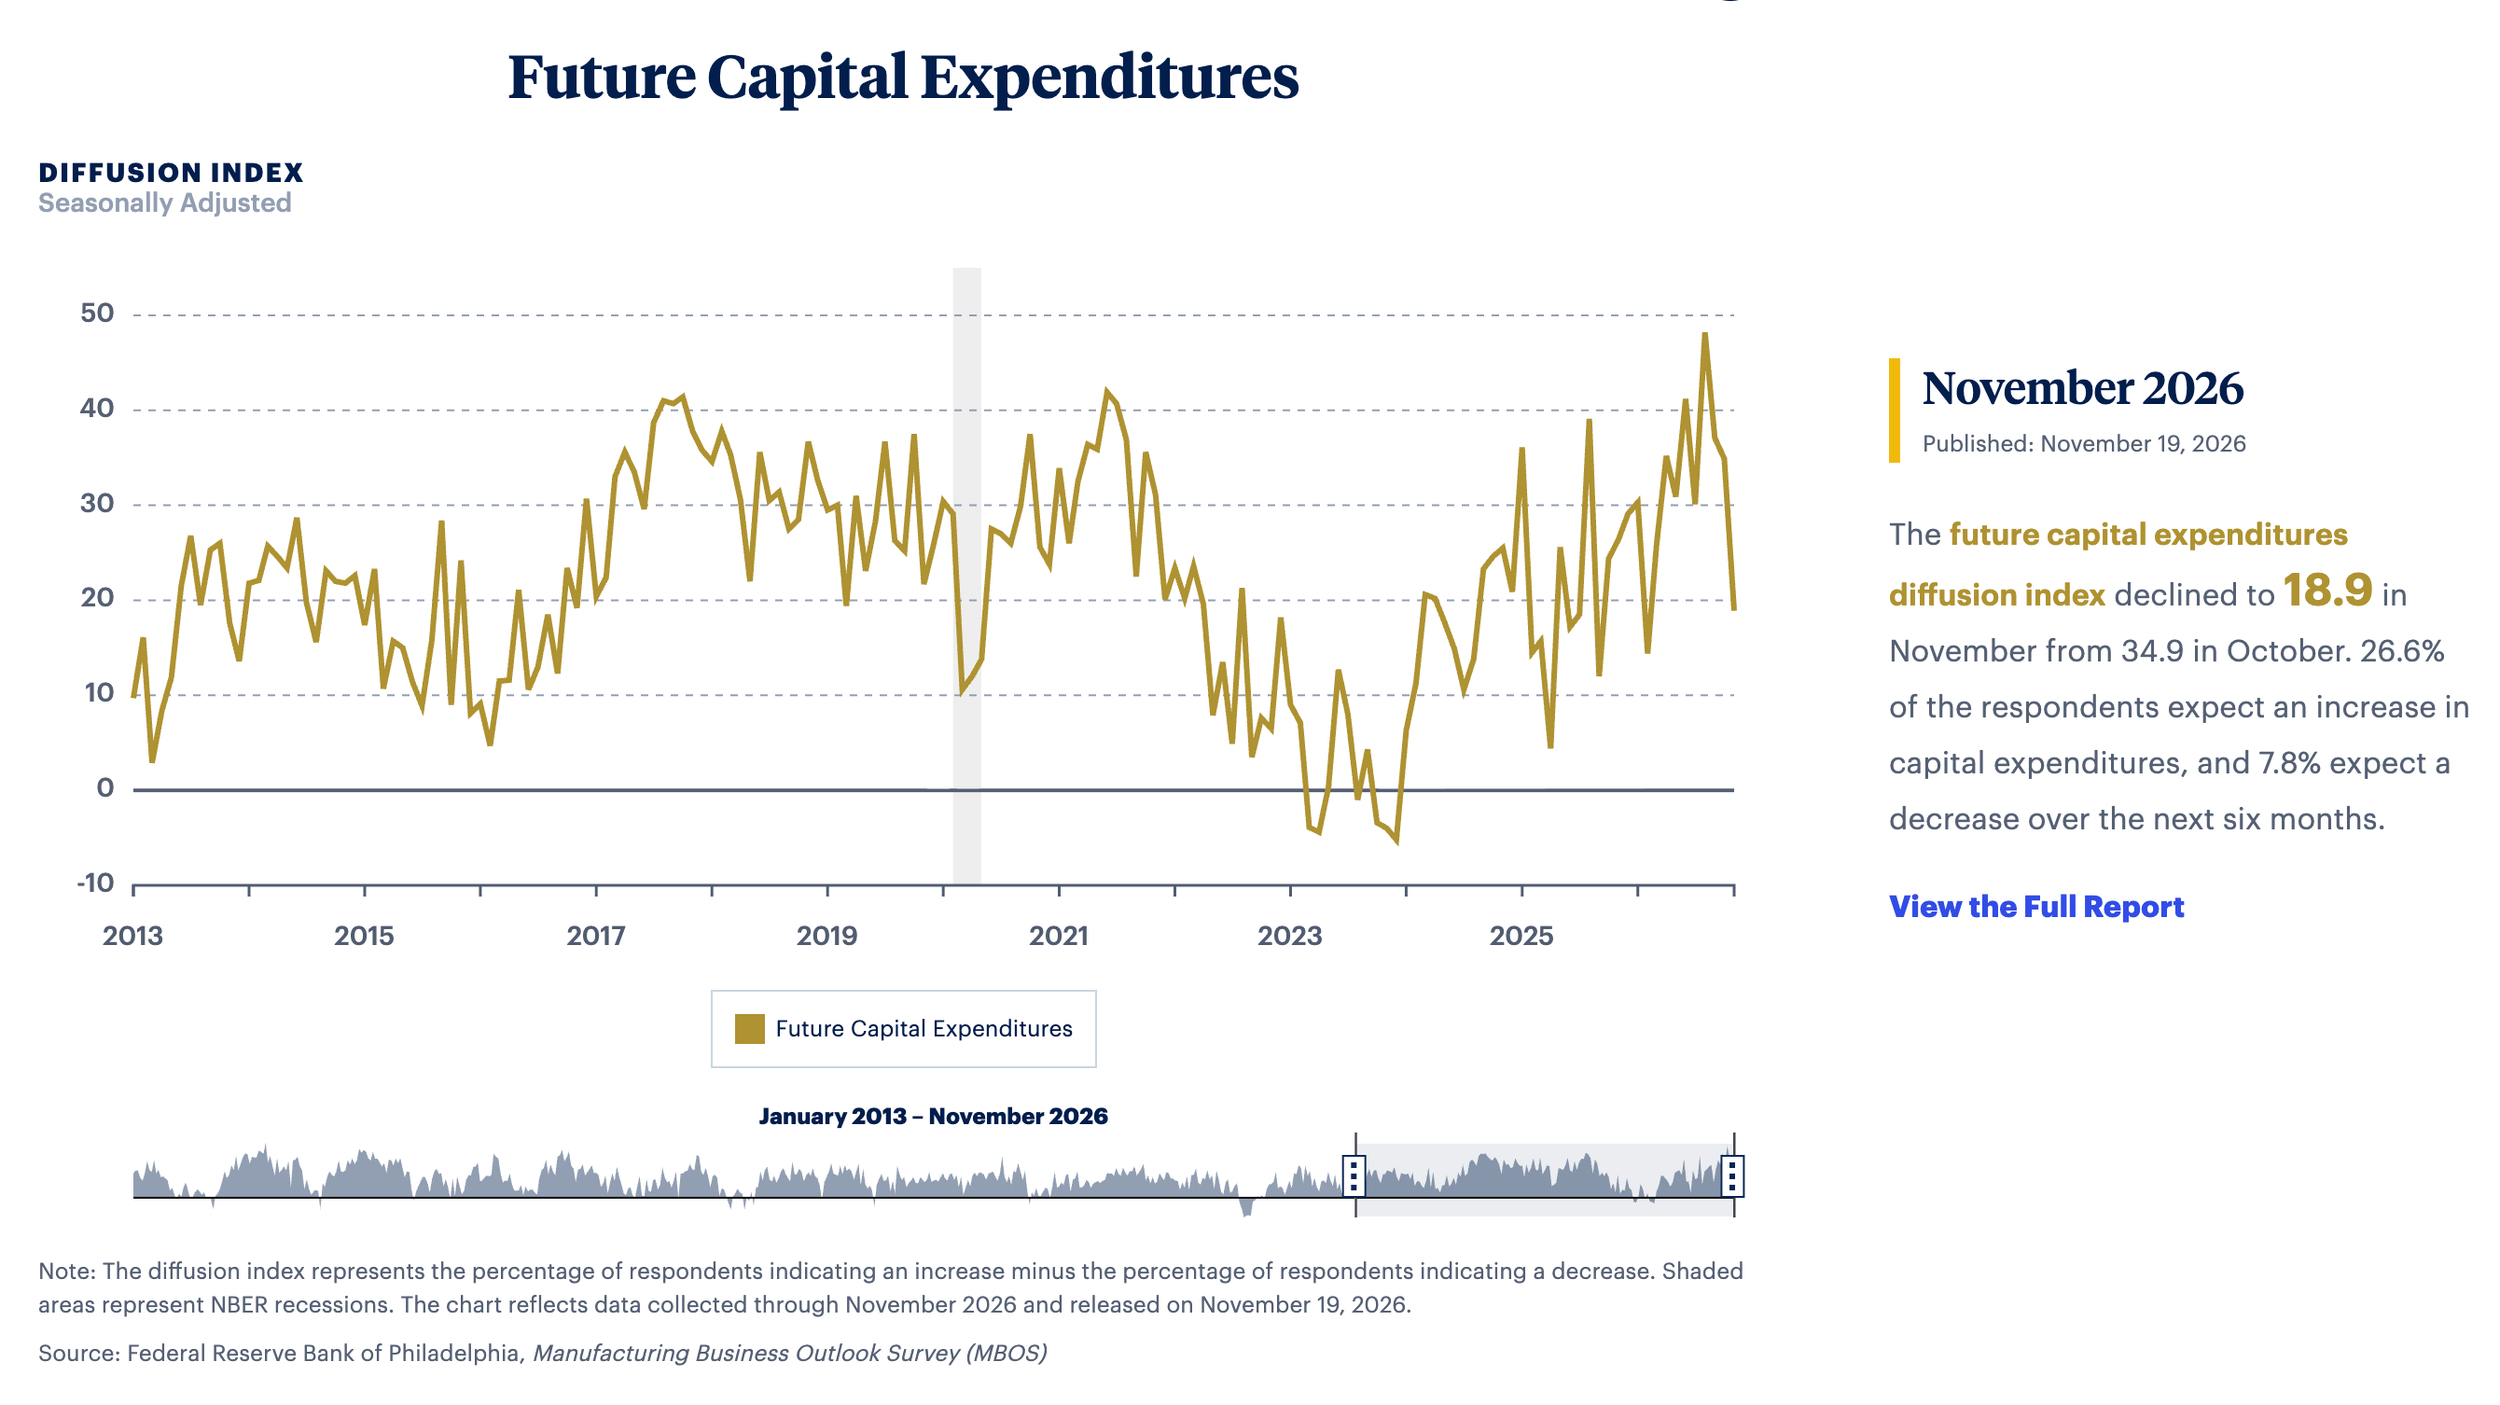
The Philadelphia Fed index plunged to 6.3, well below the expected 20, while the Conference Board’s leading economic index declined 0.3% and existing home sales fell to their weakest level since 2010. Businesses reported CAPEX plans also took a sizable turn lower.
Taking everything into account, we see the market decline as primarily a mechanical liquidation event, not an earnings recession.
This suggests as selling is overdone, at least for now. The 10-year Treasury yield dropped 24 basis points and the long-bond ETF (TLT) rose +2.6%, even as almost every other asset declined. When bonds rally while stocks fall, it signals that investors are fleeing risk. If Treasuries begin selling off together with stocks, the liquidation would have entered a more dangerous stage.
However, looking only at the first time SPY was at least -8.0% lower after 5 days, the forward returns table looks exceedingly bullish, with median returns of +3.6% and +10.19% over 1 and 3 months respectively.
Next week, the focus will be on the Fed and on Wednesday’s PCE data. If we get a cool print, this would allow Fed speakers to soften and turn dovish. The setup for a reflexive rally would come into play and higher market prices become feasible. In our view, the Fed is the sole fundamental catalyst for a rebound rally currently.
If inflation data comes in hot and the Fed keeps hiking, we may see a repeat of 2018, when stocks only bottomed on Christmas Eve.
Technically speaking, the market is clearly oversold (RSI below 30), trading -9.4% below its 50-DMA and -11% below its all-time-high.
There are 2 key developments which warrant our attention: the 200-DMA break and the close below the 2Y trading channel lower trendline. We will explore the meaning of each below.
The 200-DMA is probably the most important technical indicator due to its universal nature. It is followed by retail traders, hedge funds and institutions alike. There’s a Wall Street adage that says “nothing good happens below the 200-DMA”. But not all breaks below the metric are created equal.
First of all, a 200-DMA break, by itself, holds no predictive value. Forward returns are in line with investing on any other day.
What about the distance between the last close and the 200-DMA (currently at 6%)? Since 2009, whenever the distance was higher than 5.5%, forward returns were exceedingly bullish, confirming the base case scenario laid out at the start of this article. After such a reading, median returns after 1 and 3 months were +3.3% and +9.5% respectively, with overwhelmingly positive odds. The average decline after 3 months was just -3.5%.
What about the time spend by SPY below the 200-DMA? This is where things get interesting…
Returns table after SPY closing at least -5.5% below 200-DMA
As the time spent below the 200-DMA increases, the medium and long term prospects for market returns also decrease.
If SPY trades below the 200-DMA for 20 consecutive sessions, returns at the next 1, 3, 6 and 12 month intervals average paltry values. In other words, the market needs to recapture the 200-DMA by December 17, or else odds turn heavily against the bulls. Analysis by Carson Research suggests that around half of 200-DMA breaks since 1950 managed a reclaim within that timespan.
Returns table after SPY closing below 200-DMA for 20 consecutive sessions
Now for the secondary key technical development: SPY’s break below the 2Y lower channel trendline (currently at $698.88, or Z-Score -1.00). This level acts as a stop loss for the equity sleeve of the Enterprise strategy. Breaking below it has triggered the full closing of the SPY position within the model, which will occur during Monday’s session.
As long as the Z-Score -1.00 level is not reclaimed, equities will no longer be part of the Enterprise strategy, which forms the core of our asset allocation framework.
Furthermore, the exclusion of stocks from the Enterprise strategy will show up as a “Risk-off” regime (red bar) on the Enterprise Regime study. Long exposure during a risk-off regime tends to not pay off, as the name suggests (just +1.25% and +2.9% average 3 and 6-Month returns). That’s the reason a general stop loss exists to begin with.
However, there is a useful nuance to this system, especially in the event of a rally. The sequence of regime change matters. Right now, we’re getting a yellow → red change, which is the standard “liquidity event” variety (Covid crash, Tariff Tantrum, Iran War, 2018 Volmageddon). All of these episodes saw a relatively swift, V-shaped recovery.
But there is also another type of regime change which is far more dangerous. The green → red change. This happens on a failed rally.
First off, it would be entirely feasible for the market to re-test the 200-DMA (from below) and stage a +5% bounce. This would also take SPY back into its trading channel and increase the odds that our system will re-allocate strongly toward stocks in order to take advantage of the new bull run.
A higher allocation to stocks would show up as green shading on our study. However, should the rally fail and send SPY back below below the stop loss level again, we would get that green → red transition. These have occured during 2008 - 2009, 2015-2016, as well as 2022-2023 — periods which were far more painful and long lasting than the aforementioned liquidity events. This is what we really want to avoid.
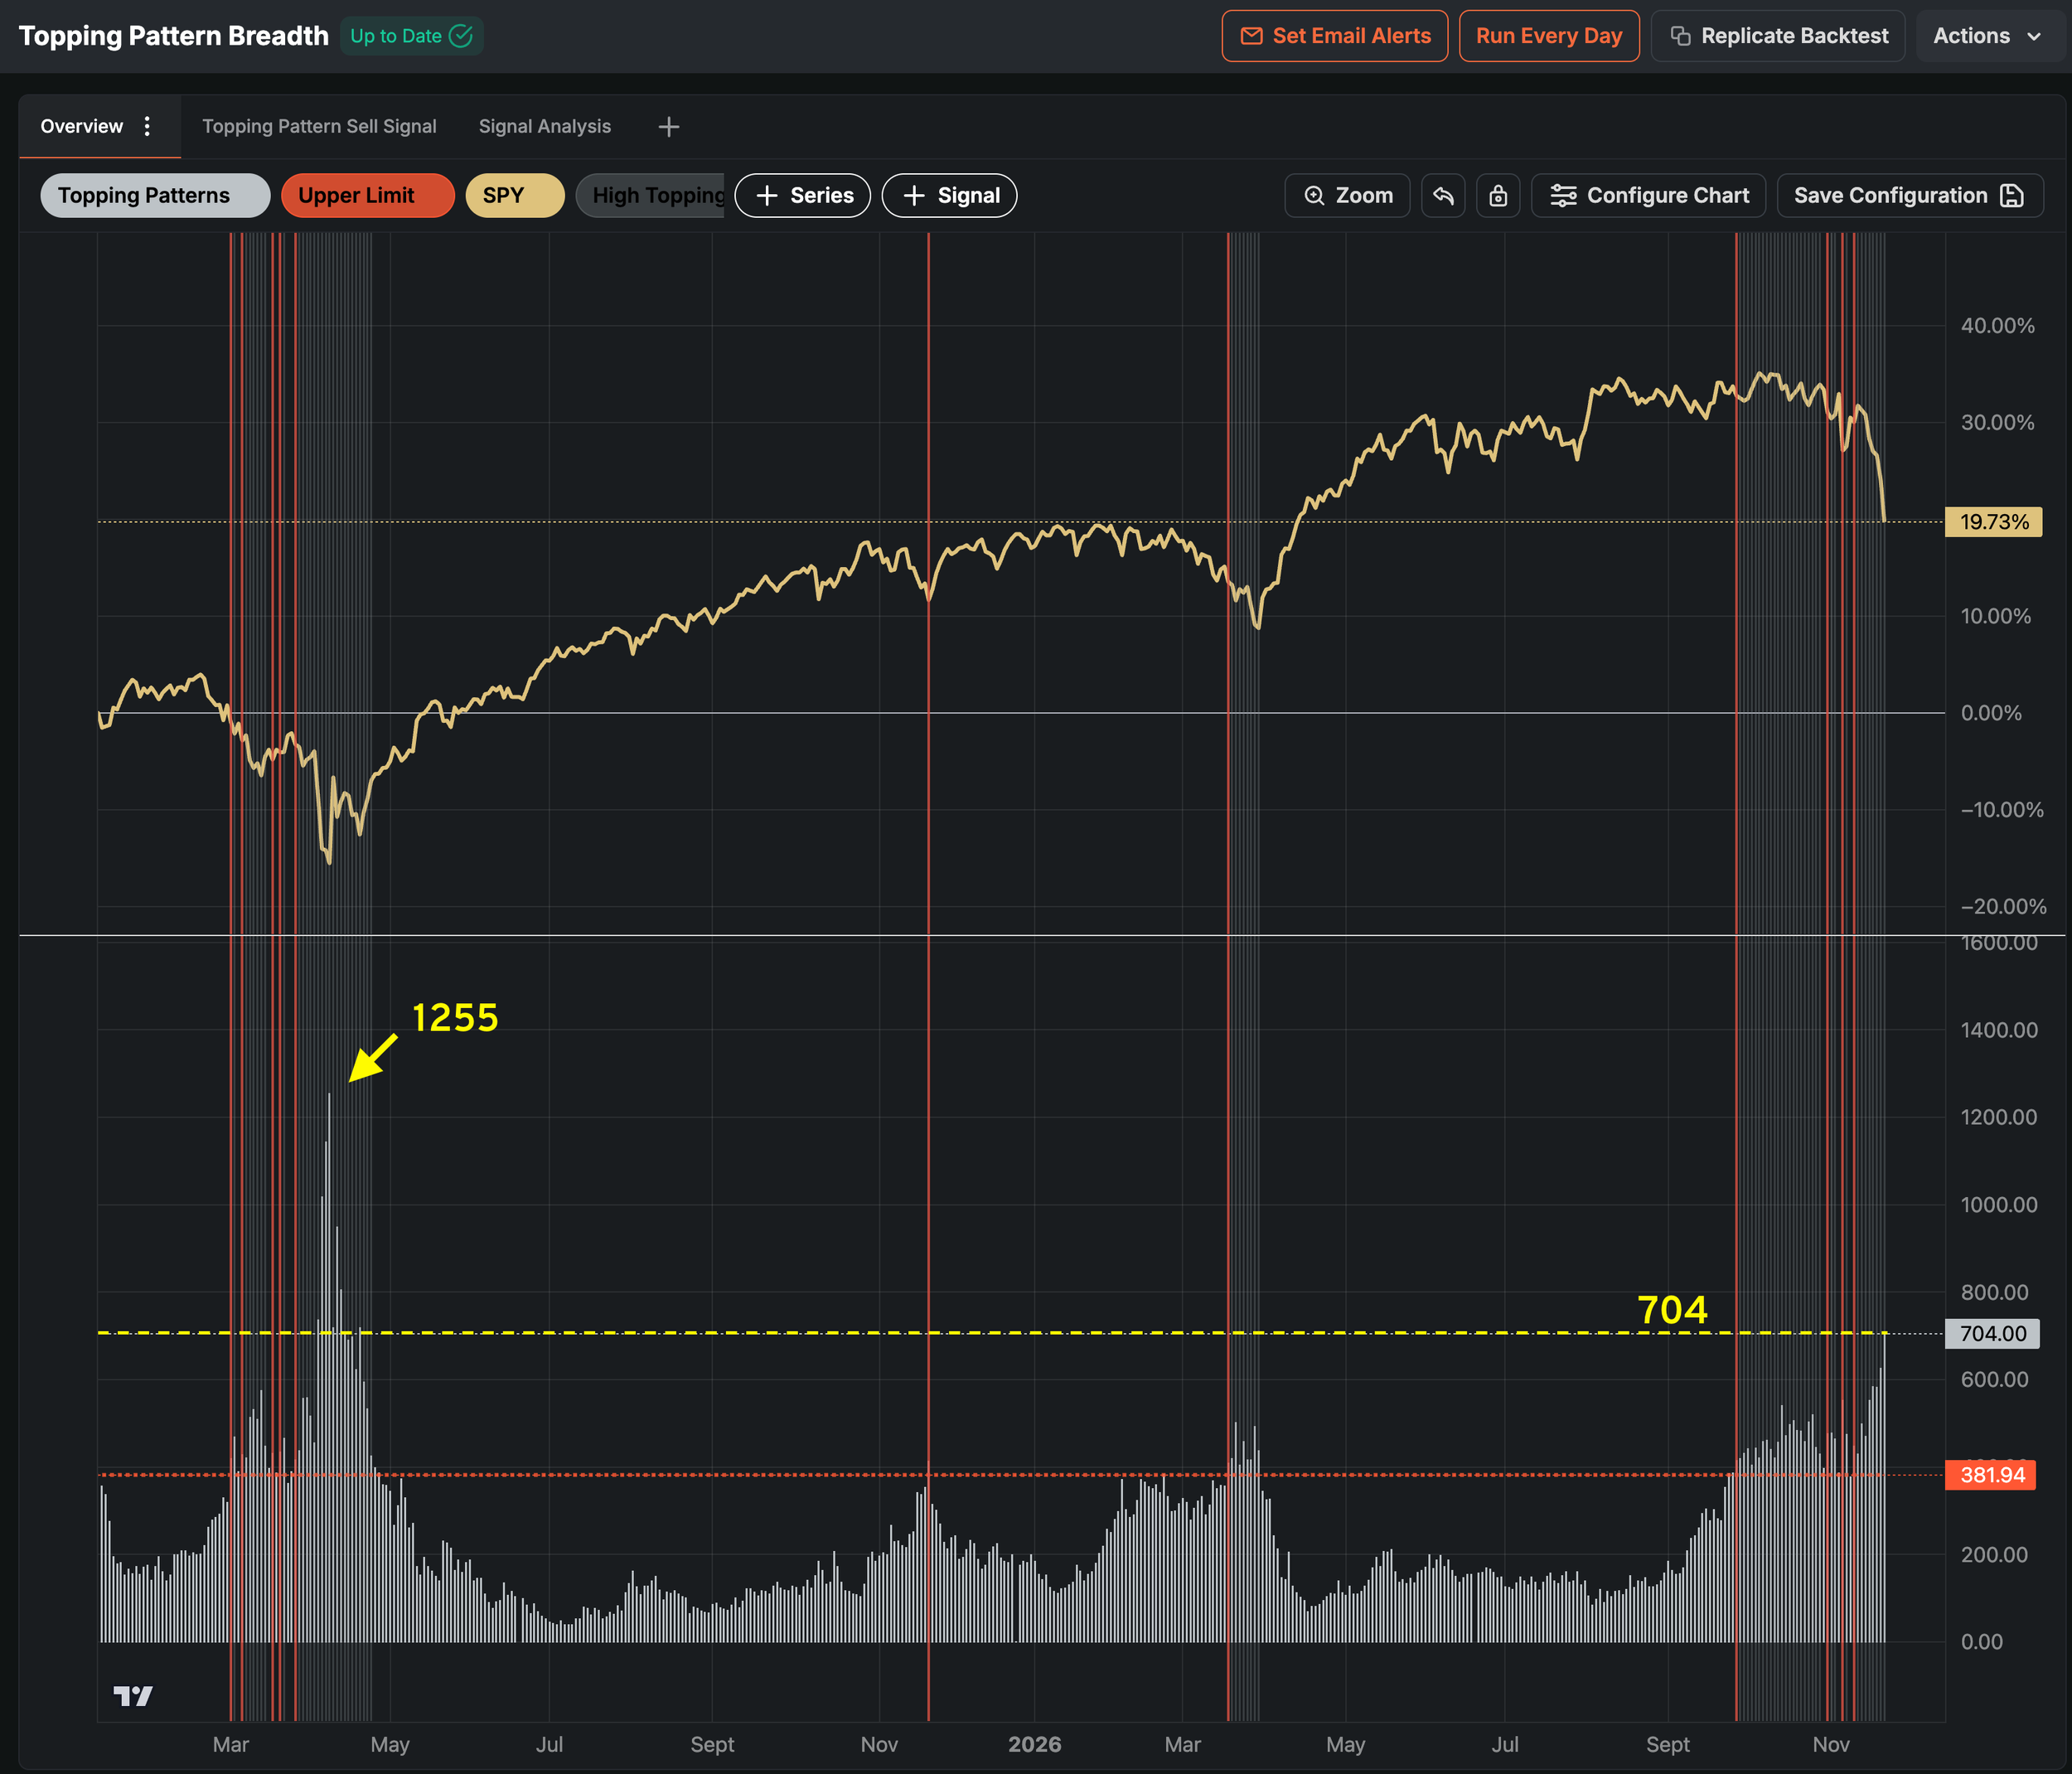
Our Topping pattern breadth study suggests that “the bottom” is not in by quite a margin. During the Tariff tantrum episode, 1255 stocks registered this condition, while the metric recorded over 1500 issues during the 2022-2023 bear market. As of last Friday, only 704 stocks met these conditions.
During the Covid crash, 748 stocks were registering a topping pattern on March 09. The market went on -24% lower from that point, to form its bottom, on March 23.
On the question of “capitulation” — the answer is a definite “not yet”.
Thanksgiving week will be compressed into just three trading sessions, with markets closed Thursday and an early 1 p.m. ET close on Friday. Thin holiday volume often amplifies swings in both directions, and with the VIX at 37, this is a period when investors are prone mistakes.
The main focus is the Fed. Wednesday’s October personal income and spending report is expected to show core PCE up 0.3% month-over-month and 3.2% year-over-year. A hotter reading would tilt the December debate toward Christopher Waller’s call for a 50-basis-point hike; a softer one would strengthen the case for a smaller move. Futures already price in a quarter-point hike, so the question is size rather than direction. The Beige Book arrives the same afternoon, and New York Fed President John Williams (FOMC vice chair) speaks Monday afternoon. After pushing back against a half-point hike on November 17, any further sign of flexibility from him would carry significant weight.
Growth data will also be watched closely. Monday’s flash PMIs and Tuesday’s consumer confidence (expected at 92) will indicate whether the sharp drop in the Philadelphia Fed index was an outlier. Wednesday brings the second estimate of third-quarter GDP (expected at 3.5%), along with durable goods orders and weekly jobless claims, the latter shifted earlier because of the holiday.
Two wildcards sit outside the calendar. Anthropic’s first full week of trading after falling 13% on Friday will influence AI sentiment into year-end. Geopolitics is the other: Wolfe Research’s Chris Senyek noted that the lack of an Iran peace deal remains an overhang, alongside inflation and AI concerns—both capable of moving markets in thin holiday trading.
Earnings are sparse, but a few reports matter for the AI and industrial narrative. Dell and Hewlett Packard Enterprise will offer insight into AI server demand following the new chip-access rules, while Deere provides a read on the industrial and farm economy.
Our Trading Strategy (Sigma Portfolio)
As of right now, we are over-allocated to the equity market versus our core model. Depending on what the market does next, we will seek to re-calibrate. There are essentially 3 scenarios:
A reflexive rally to the 200-DMA that sticks (recaptures the level on a weekly close basis) → we will add exposure and benefit from the new bull run;
A reflexive rally to the 200-DMA that fails → we will use the rally to reduce exposure at better prices;
A continued degradation or no 200-DMA recapture by December 16 → general equites stop loss, go mostly to cash;
Client portfolios which are below target allocation will remain as such for the time being. No fresh capital is being deployed until we get a better sense of direction.
The odds are that this is a “liquidity event” and not the start of a protracted bear market (65%). The fundamentals are there to argue this point, as an earnings recession seems to be out of the question. There is a real risk of a policy error by the Fed, however. Our belief is that a 50-bps rate hike is completely unwarranted given the supply-side nature of the current inflation episode. Even if the Fed hikes by 50bps, the effects would take 9-12 months to fully impact the economy. An inverted yield curve (a typical Fed mistake gauge) would be there to warn us.
As usual, we will update you via trade alerts for any portfolio changes in the coming period.
Have a blessed Thanksgiving and all the best from all of us at Signal Sigma!
Disclosures / Disclaimers: This is not a solicitation to buy, sell, or otherwise transact any stock or its derivatives. Nor should it be construed as an endorsement of any particular investment or opinion of the stock’s current or future price. To be clear, I do not encourage or recommend for anyone to follow my lead on this or any other stocks, since I may enter, exit, or reverse a position at any time without notice, regardless of the facts or perceived implications of this blog post. I currently do not own or plan to own any position, long or short, in the securities mentioned.
I am not a financial advisor licensed in the United States. Nor am I providing any recommendations, price targets, or opinions about valuation regarding the companies discussed herein. Any disclosures regarding my holdings are true as of the time this article is written, but subject to change without notice. I frequently trade my positions, often on an intraday basis. Thus, it is possible that I might be buying and/or selling the securities mentioned herein and/or its derivative at any time, regardless of (and possibly contrary to) the content of this blog post.
I undertake no responsibility to update my disclosures and they may therefore be inaccurate thereafter. Likewise, any opinions are as of the date of publication, and are subject to change without notice and may not be updated. I believe that the sources of information I use are accurate but there can be no assurance that they are. All investments carry the risk of loss and the securities mentioned herein may entail a high level of risk. Investors considering an investment should perform their own research and consult with a qualified investment professional.
I wrote this blog post myself, and it expresses my own opinions. I do not have a business relationship with any company whose stock is mentioned in this blog post. The information in this blog post is for informational purposes only and should not be regarded as investment advice or as a recommendation regarding any particular security or course of action.
The primary purpose of this blog post is to share industry expertise and research and receive feedback (confirmation / refutation) regarding my investment theses.