/ November 24 / Weekly Preview
-
Monday:
N/A
---
Tuesday:
ADP Employment Change Weekly
PPI MoM (0.3% exp.)
Retail Sales MoM (0.4% exp.)
CB Consumer Confidence
---
Wednesday:
Initial Jobless Claims
Durable Goods Orders MoM (0.2% exp)
---
Thursday:
N/A
---
Friday:
N/A
-
Monday:
Agilent Technologies, Inc.
Keysight Technologies Inc.
---
Tuesday:Alibaba Group Holding Limited BHP Group Limited
Analog Devices, Inc.
Dell Technologies Inc.
Autodesk, Inc.
Workday, Inc.
Zscaler, Inc.
---
Wednesday:
Deere & Company
JBS N.V.
Li Auto Inc.
---
Thursday:
N/A
---
Friday:
N/A
Opportunity or Warning in the AI Trade?
Got a question about the markets, your investments, or a topic you’d like us to discuss in an upcoming article? We read every message and may feature your question in our daily write-ups!
Email: andrei@signal-sigma.com
Follow & DM on X: @signal_sigma
Last week, markets experienced a series of volatile trading sessions, as AI and Crypto related investments took a beating. The S&P 500 and the Nasdaq both closed lower for the week, but managed a bounce on Friday, as options expirations took hold.
Selling pressure was consistent in semiconductor stocks as well, reversing previous overbought conditions. At the moment, many stocks in our AI-themed watchlist are currently experiencing drawdowns which are higher than their corresponding average. The average drawdown for the group now sits at -25%, definitely a significant number.
In this context it’s natural to ask the question - is this a buying opportunity or is there more pain to come? Let’s explore…
First of all, this dismal showing is occurring on the back of stellar earnings from Nvidia, announced Thursday evening. Nvidia’s earnings report clearly exceeded expectations across almost all key metrics.
Revenue increased 34% quarter-over-quarter, driven by a 41% rise in data center sales. The demand for high-performance GPUs continues to surpass supply, and CEO Jensen Huang dismissed concerns about a bubble, stating, “This is the beginning of a new industrial revolution.” This statement garnered widespread attention for good reason.
Following the earnings release, the stock’s rally boosted the entire tech sector at least for half a trading day before entirely unwinding. Fundamentally, it reinforced the year’s prevailing trend: investment in AI infrastructure.
NVDA’s numbers make it clear that capital expenditures in AI, particularly by the largest tech platforms, remain in a strong up-trend. As Microsoft, Amazon, and Meta aggressively scale up AI buildouts, NVDA sits at the center of that capital flow and informs us on the health of the entire industry.
However, all of this spending is happening on the backdrop of mounting debt issuance in key AI-leveraged firms. Wall Street is starting to view that as a problem, which is becoming reflected in share prices as well as CDS swaps for particular corporate bonds.
For instance, the 5-year CDS spread for Oracle Corporation has risen sharply to above 100 basis points, significantly higher than earlier this year, indicating a greater cost to insure its debt. Additionally, the trading volume of CDS linked to AI sector debt reached around $4.2 billion over a recent six-week timeframe. This adds another layer of complexity, since refinancing and interest-rate risks were not normally part of the mega-cap equation.
Credit Default Swaps (CDS for short) are derivative contracts in which one party, the default protection buyer, pays a quarterly fee, expressed in basis points. In return, the counterparty, or protection provider, assures that in the event of default, the buyer will receive par for their bonds. CDS spreads, or the cost of default insurance, provide the market with an easy way to quantify the implied market default probability.
Companies which need future large cash flows to justify current expenditures and debt loads will eventually need to prove that they have the ability to convert promises into profits. They are increasingly being scrutinized on execution, earnings, and balance-sheet resilience.
In other words, the excitement that fueled the rally in the AI-growth narrative phase is turning into a “show me” phase where vulnerable players will be exposed. At the moment, judging from investor positioning, Google is viewed most favorably, as they are the only major player to not rely on NVDA infrastructure at all (instead, Google uses their own Tensor Processing Units for Gemini models).
META, and to a lesser extent Oracle are seen as highly vulnerable.
So are we at a dip buying juncture in the tech space or is there more downside ahead?
A report from McKinsey & Co highlights that generative AI and other advanced AI applications could generate up to $4.4 trillion in productivity gains for business users alone. Additionally, research by S&P Global projects the market for code-generation tools to expand at a compound annual growth rate of approximately 53% between 2024 and 2029.
These findings emphasize a widespread consensus: organizations implementing AI on a large scale are expected to experience both revenue growth and enhanced cost efficiencies. The demand for GPUs continues to be extremely strong, causing hardware to sell out even as supply has increased, indicating that adoption is progressing rapidly. Fundamentals look solid.
The question that remains sits on the other side of the investing equation: how much investors are willing to pay for these fundamentals. From a pure price-to-sales perspective, we’re seeing significant valuation discounts in stocks like PLTR, SNOW, CRWD, FTNT, whereas GOOG, AAPL and MSFT sit near the top of their valuation range.
In other words, it pays for investors to be selective. One particularly useful way we can optimize any subset of stocks is by using 2 of our most important metrics:
Medium Term GEX-to-Volume (set to values above 0)
Millennium Alpha Rank Number (top 15 shares)
You can add the following screener to your profile in order to get this 15-stock AI themed strategy.
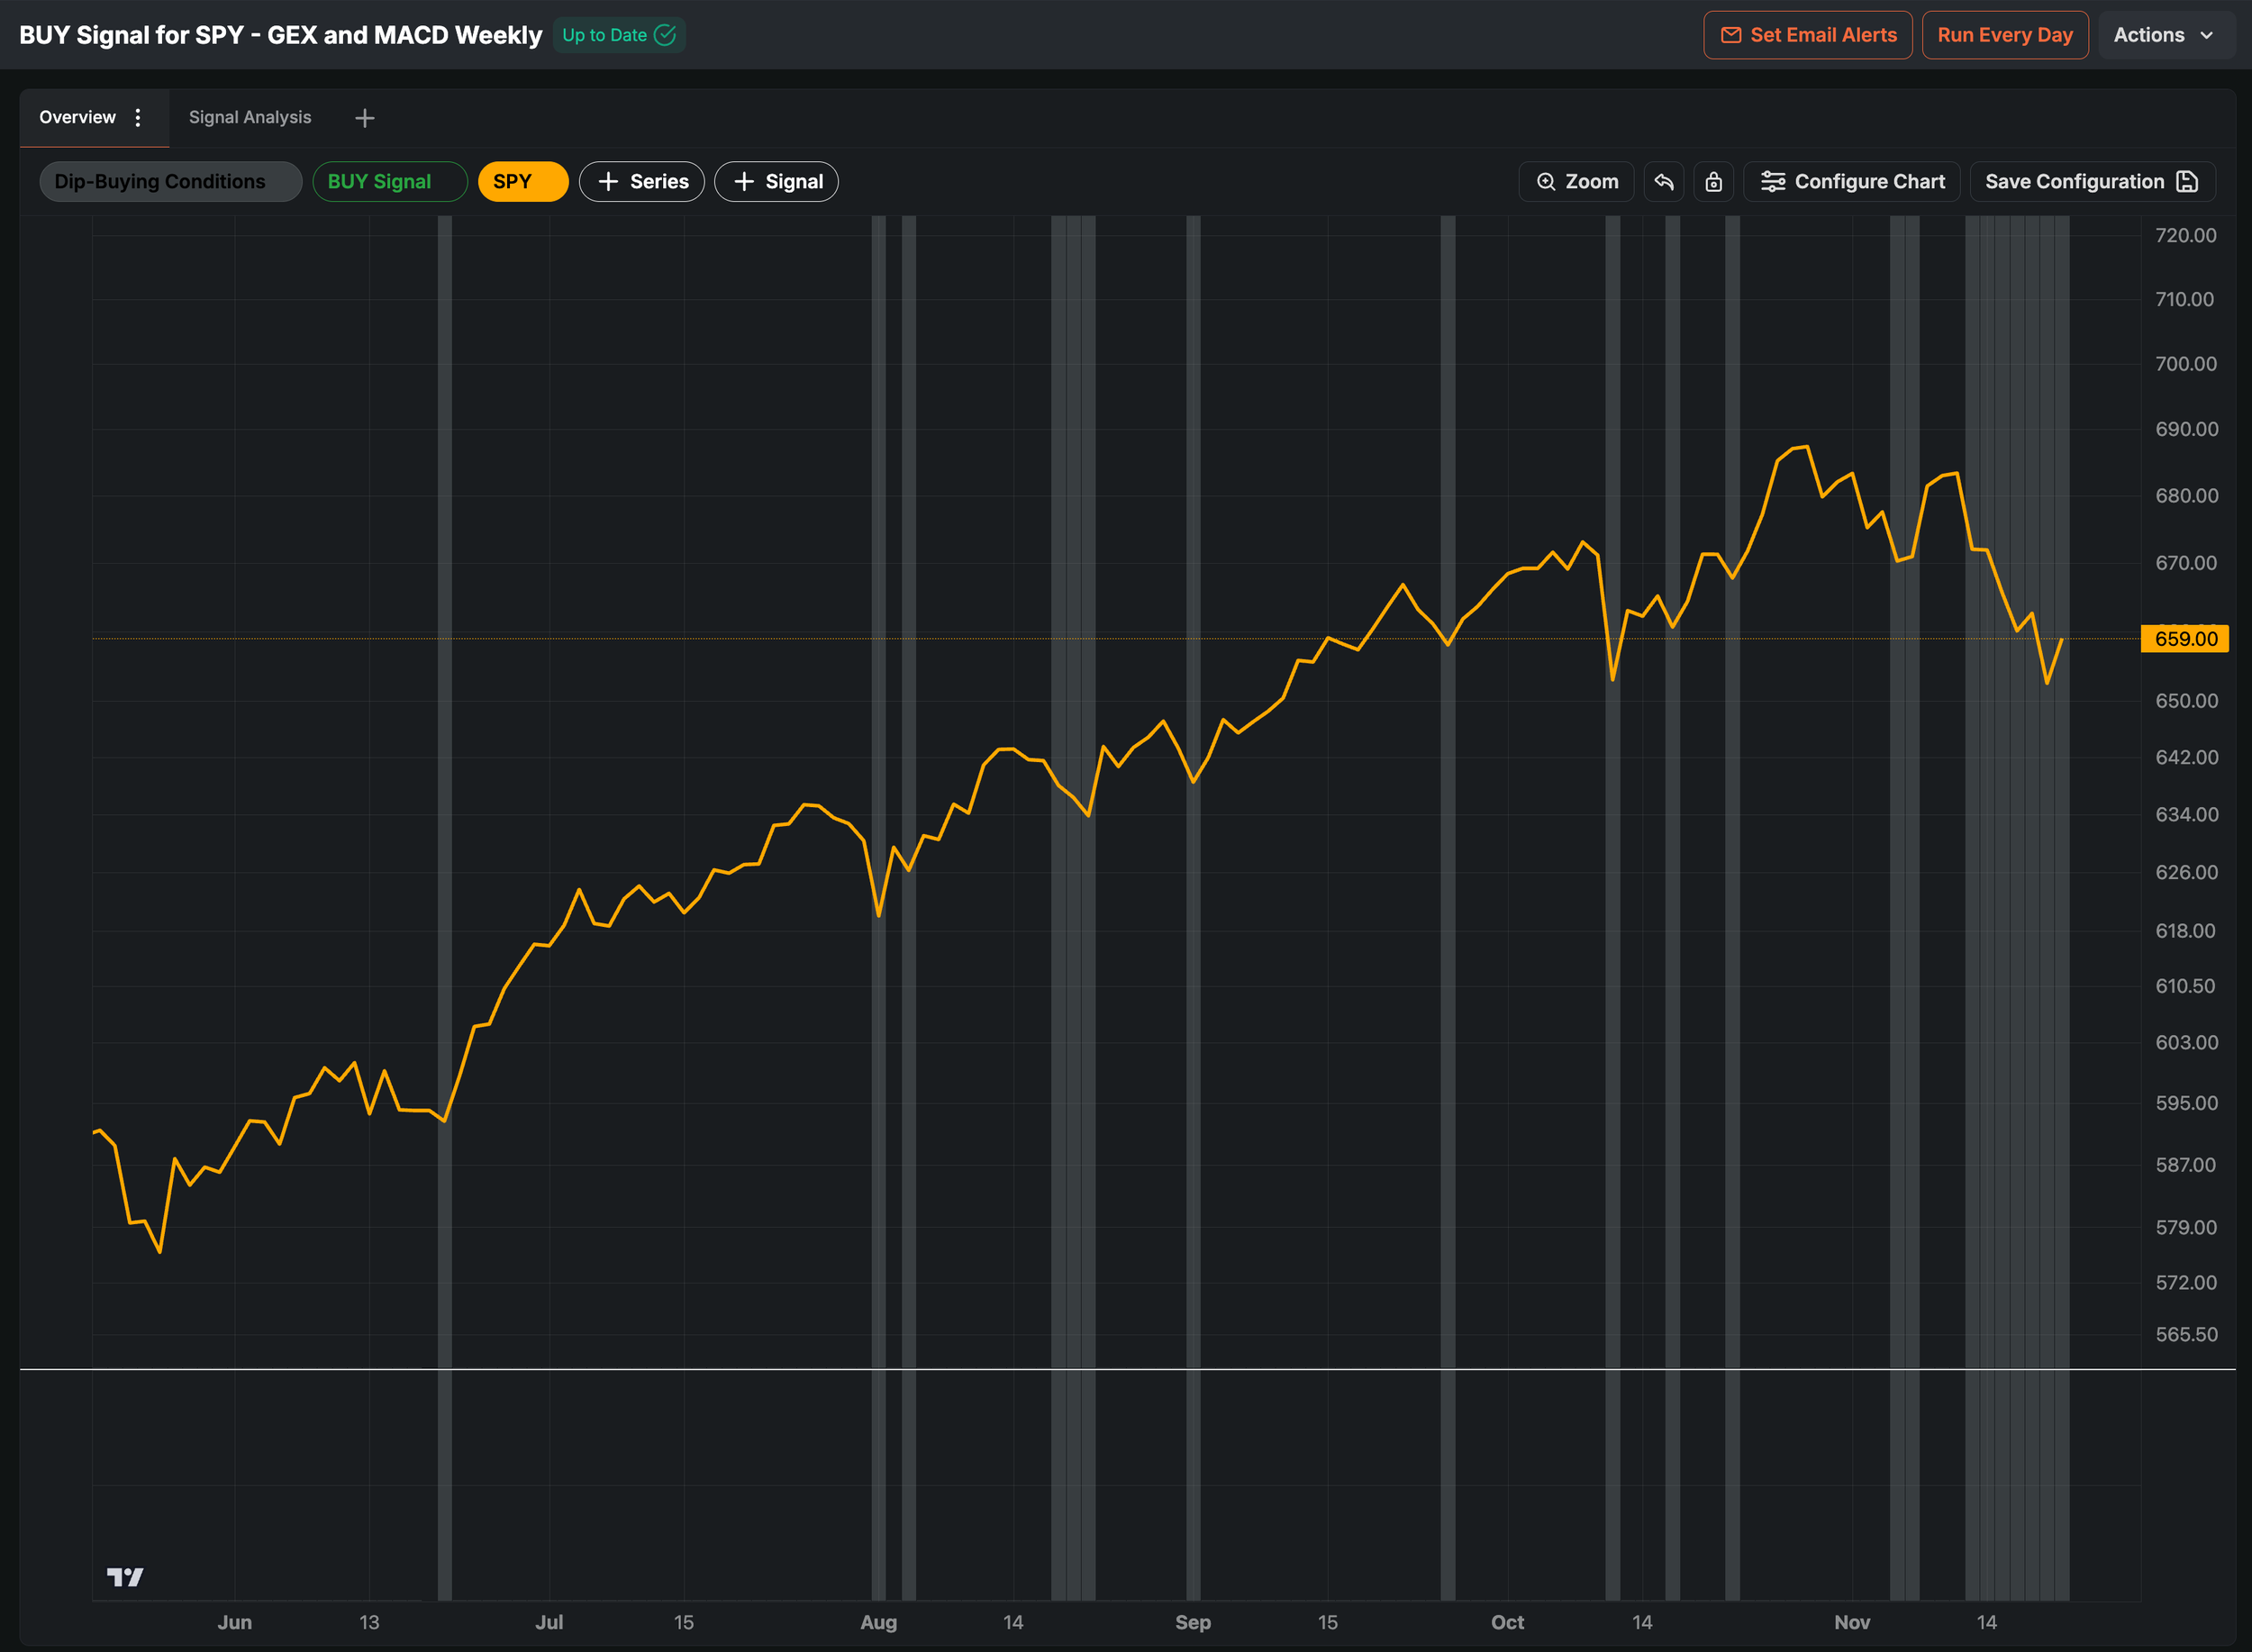
The broader technical underpinnings of the market remain fragile, however. In a recent study that we just refined (Stocks in Topping Patterns), this particular breadth metric gave us a warning that’s hard to ignore.
On Thursday (20’th), more than 397 stocks were recorded to have had broken technical setups (a topping pattern). In the past, whenever the number of stocks exceeded this threshold, 1-Month returns for SPY were negative (counting from the first occurance), with median losses hovering between -2% and -3%.
SPY only finished higher 1-month after this signal on 35% of occasions, making this one of the most effective short term sell-signals we have researched here on Signal Sigma (note: the actual sell signal is the dark orange vertical bar at the start of each topping pattern cluster).
While no continuing cluster has yet to be recorded (the signal fired a single instance), we have to also take the full context into account. Click the orange links to add the studies to your profile:
SPY is no longer in a Buying Regime;
Several other effective Sell Signals are also in play;
Our Enterprise Strategy has a limited exposure to equities at the moment;
There has been no major reversal in Tech Dark Pools buying;
Our short term BUY signal has not yet triggered for a potential reversal, remaining in “wait-and-see” mode;
A significantly negative 1 month from this point onward would contradict the last 10 years of seasonal patterns however. The November 21 - December 31 period is usually marked by average gains of +2%, though there have been several instances of negative or barely positive returns (SPY is down -1.4% for the quarter starting Oct. 01, for context).
Seasonality should act as a tailwind for stocks going forward.
Our Trading Strategy
In summary, solid fundamental factors underpin the AI opportunity, fueled by a large addressable market, rapid adoption, and prospects for margin improvement. However, caution is warranted due to high valuations, narrow margins for error, and a market that has largely priced in the anticipated growth by this point.
For patient, long term investors, buying positions in companies with proven execution and realistic valuations makes sense. There will be lots of volatility along the way, but returns will likely make up for it.
Chasing momentum in speculative names while expecting short term gains will likely backfire. Increasingly, the trading environment is becoming choppy, with unpredictable supply/demand shakeouts creating vast reversals (see Thursday’s market action).
In our view, the market remains in a “yellow alert” type environment, where “buying the dip” requires a bit more than “the dip existing” so to speak. In other words, we need an entire ecosystem of signals and metrics to align in support of more aggressive exposure. At the moment, such an environment does not exist.
As a result, our exposure needs to be balanced, ready to take on risk if the situation improves, but also to honor stop-loss levels if technicals deteriorate. There is certainly room for downside if selling has not yet been exhausted, so we need to keep that in mind and limit losses where possible in the short term.
Signal Sigma Research & PRO members will be notified by Trade Alert of any live portfolio changes (if subscribed). If you’re not on this plan yet, you can get a free trial when you join our Society Forum. If you need any help with your trading strategy (or would like to implement one on your account), feel free to reach out!
Disclosures / Disclaimers: This is not a solicitation to buy, sell, or otherwise transact any stock or its derivatives. Nor should it be construed as an endorsement of any particular investment or opinion of the stock’s current or future price. To be clear, I do not encourage or recommend for anyone to follow my lead on this or any other stocks, since I may enter, exit, or reverse a position at any time without notice, regardless of the facts or perceived implications of this blog post. I currently do not own or plan to own any position, long or short, in the securities mentioned.
I am not a financial advisor licensed in the United States. Nor am I providing any recommendations, price targets, or opinions about valuation regarding the companies discussed herein. Any disclosures regarding my holdings are true as of the time this article is written, but subject to change without notice. I frequently trade my positions, often on an intraday basis. Thus, it is possible that I might be buying and/or selling the securities mentioned herein and/or its derivative at any time, regardless of (and possibly contrary to) the content of this blog post.
I undertake no responsibility to update my disclosures and they may therefore be inaccurate thereafter. Likewise, any opinions are as of the date of publication, and are subject to change without notice and may not be updated. I believe that the sources of information I use are accurate but there can be no assurance that they are. All investments carry the risk of loss and the securities mentioned herein may entail a high level of risk. Investors considering an investment should perform their own research and consult with a qualified investment professional.
I wrote this blog post myself, and it expresses my own opinions. I do not have a business relationship with any company whose stock is mentioned in this blog post. The information in this blog post is for informational purposes only and should not be regarded as investment advice or as a recommendation regarding any particular security or course of action.
The primary purpose of this blog post is to share industry expertise and research and receive feedback (confirmation / refutation) regarding my investment theses.