S&P 500 Bottom - Up Valuation and Market Outlook
Summary
It’s not a Stock Market, but a Market of Stocks
Every quarter we like to assess the fundamental state of the market by closely analyzing the most important companies. To understand if the S&P 500 has more upside than downside, we need to define the recent rally leaders, create DCF models for each, and set price targets.
The distance from closing price to Price Target will tell us if there is indeed more upside, or if there is more risk than reward in the current setup. We shall rely on our Machine Learning models and company guidance to generate these models. The aim of this research piece is not necessarily to create accurate models individually, but as a group.
Defining Market Leadership
In order for us to focus on the correct companies, we need to find out what individual stocks are leading the market higher. Helping us achieve that goal is the concept of BETA, combined with Market-Cap. A stock’s beta is calculated using both correlation and covariance; the higher the number, the more that stock is moving with the market. Having a significant Market-Cap insures that the stock is also a driver for the market due to it’s size.

We set the screener to the top 300 companies by Market-Cap (X-Axis) and Beta to SPY to a minimum of 1 (Y-Axis) and make sure all companies are profitable by setting EBITDA higher than 0. Then, we’ll sort the screener to top 100 stocks by EBITDA. Unsurprisingly, the stocks that stand out by blending these 2 metrics include a lot of the usual suspects. We’ll note their weighting in the S&P 500 for reference:
Apple Inc. (AAPL) - 7.21%
Microsoft Corp. (MSFT) - 6.54%
Alphabet Inc. Class C & Class A (GOOG, GOOGL) - 3.94%
NVIDIA Corporation (NVDA) - 3.13%
Tesla, Inc. (TSLA) - 1.71%
Meta Platforms, Inc. Class A (META) - 1.75%
Broadcom Inc (AVGO) - 0.98%
Oracle Corporation (ORCL) - 0.48%
Adobe Systems Incorporated (ADBE) - 0.65%
There are also significant companies that we need to look at that are not necessarily “market moving” to the same extent:
Unitedhealth Group Inc (UNH) - 1.24%
Eli Lilly & Co (LLY) - 1.17%
Exxon Mobil Corp (XOM) - 1.17%
Johnson & Johnson (JNJ) - 1.07%
Procter & Gamble Co (PG) - 0.98%
Combined weight in the S&P500: 31.58% - it’s safe to say that price movements for this small subset of companies will have the most significant impact on market performance going forward.
Analyst Price Targets and Statistics
We’ll input these stocks into our Risk Explorer Screener in order to quickly assess both their fundamental and statistical risk-reward set-up.
This screener type shows us the average combined expected move to different key levels (assuming equal weight positions). We are more interested in their fundamental distance to Price-Target in this article (currently at 9.94%), so let’s adjust that for index-weighting.
That comes down to an expected 9.68% combined price appreciation, if all of these companies would reach their analyst Price Targets in the next year. However, are those Price Targets realistic? What are the underlying assumptions?
We need to investigate further and create our own models in order to validate these assumptions. We will employ the help of our ML models for this task, and set projections to Neutral. As an extra step before assigning a Price Target, we will check with individual sell-side analysts and see if they agree.
Models & Price Targets

Apple Inc. (AAPL)
Signal Sigma PT: $190 (Raise from $170)
Analyst PT: $200.68
Upside: 7.72%
Rating: BUY
Assumptions:
7% Revenue Growth
44% Gross Margins
12.5% OpEx pct Sales
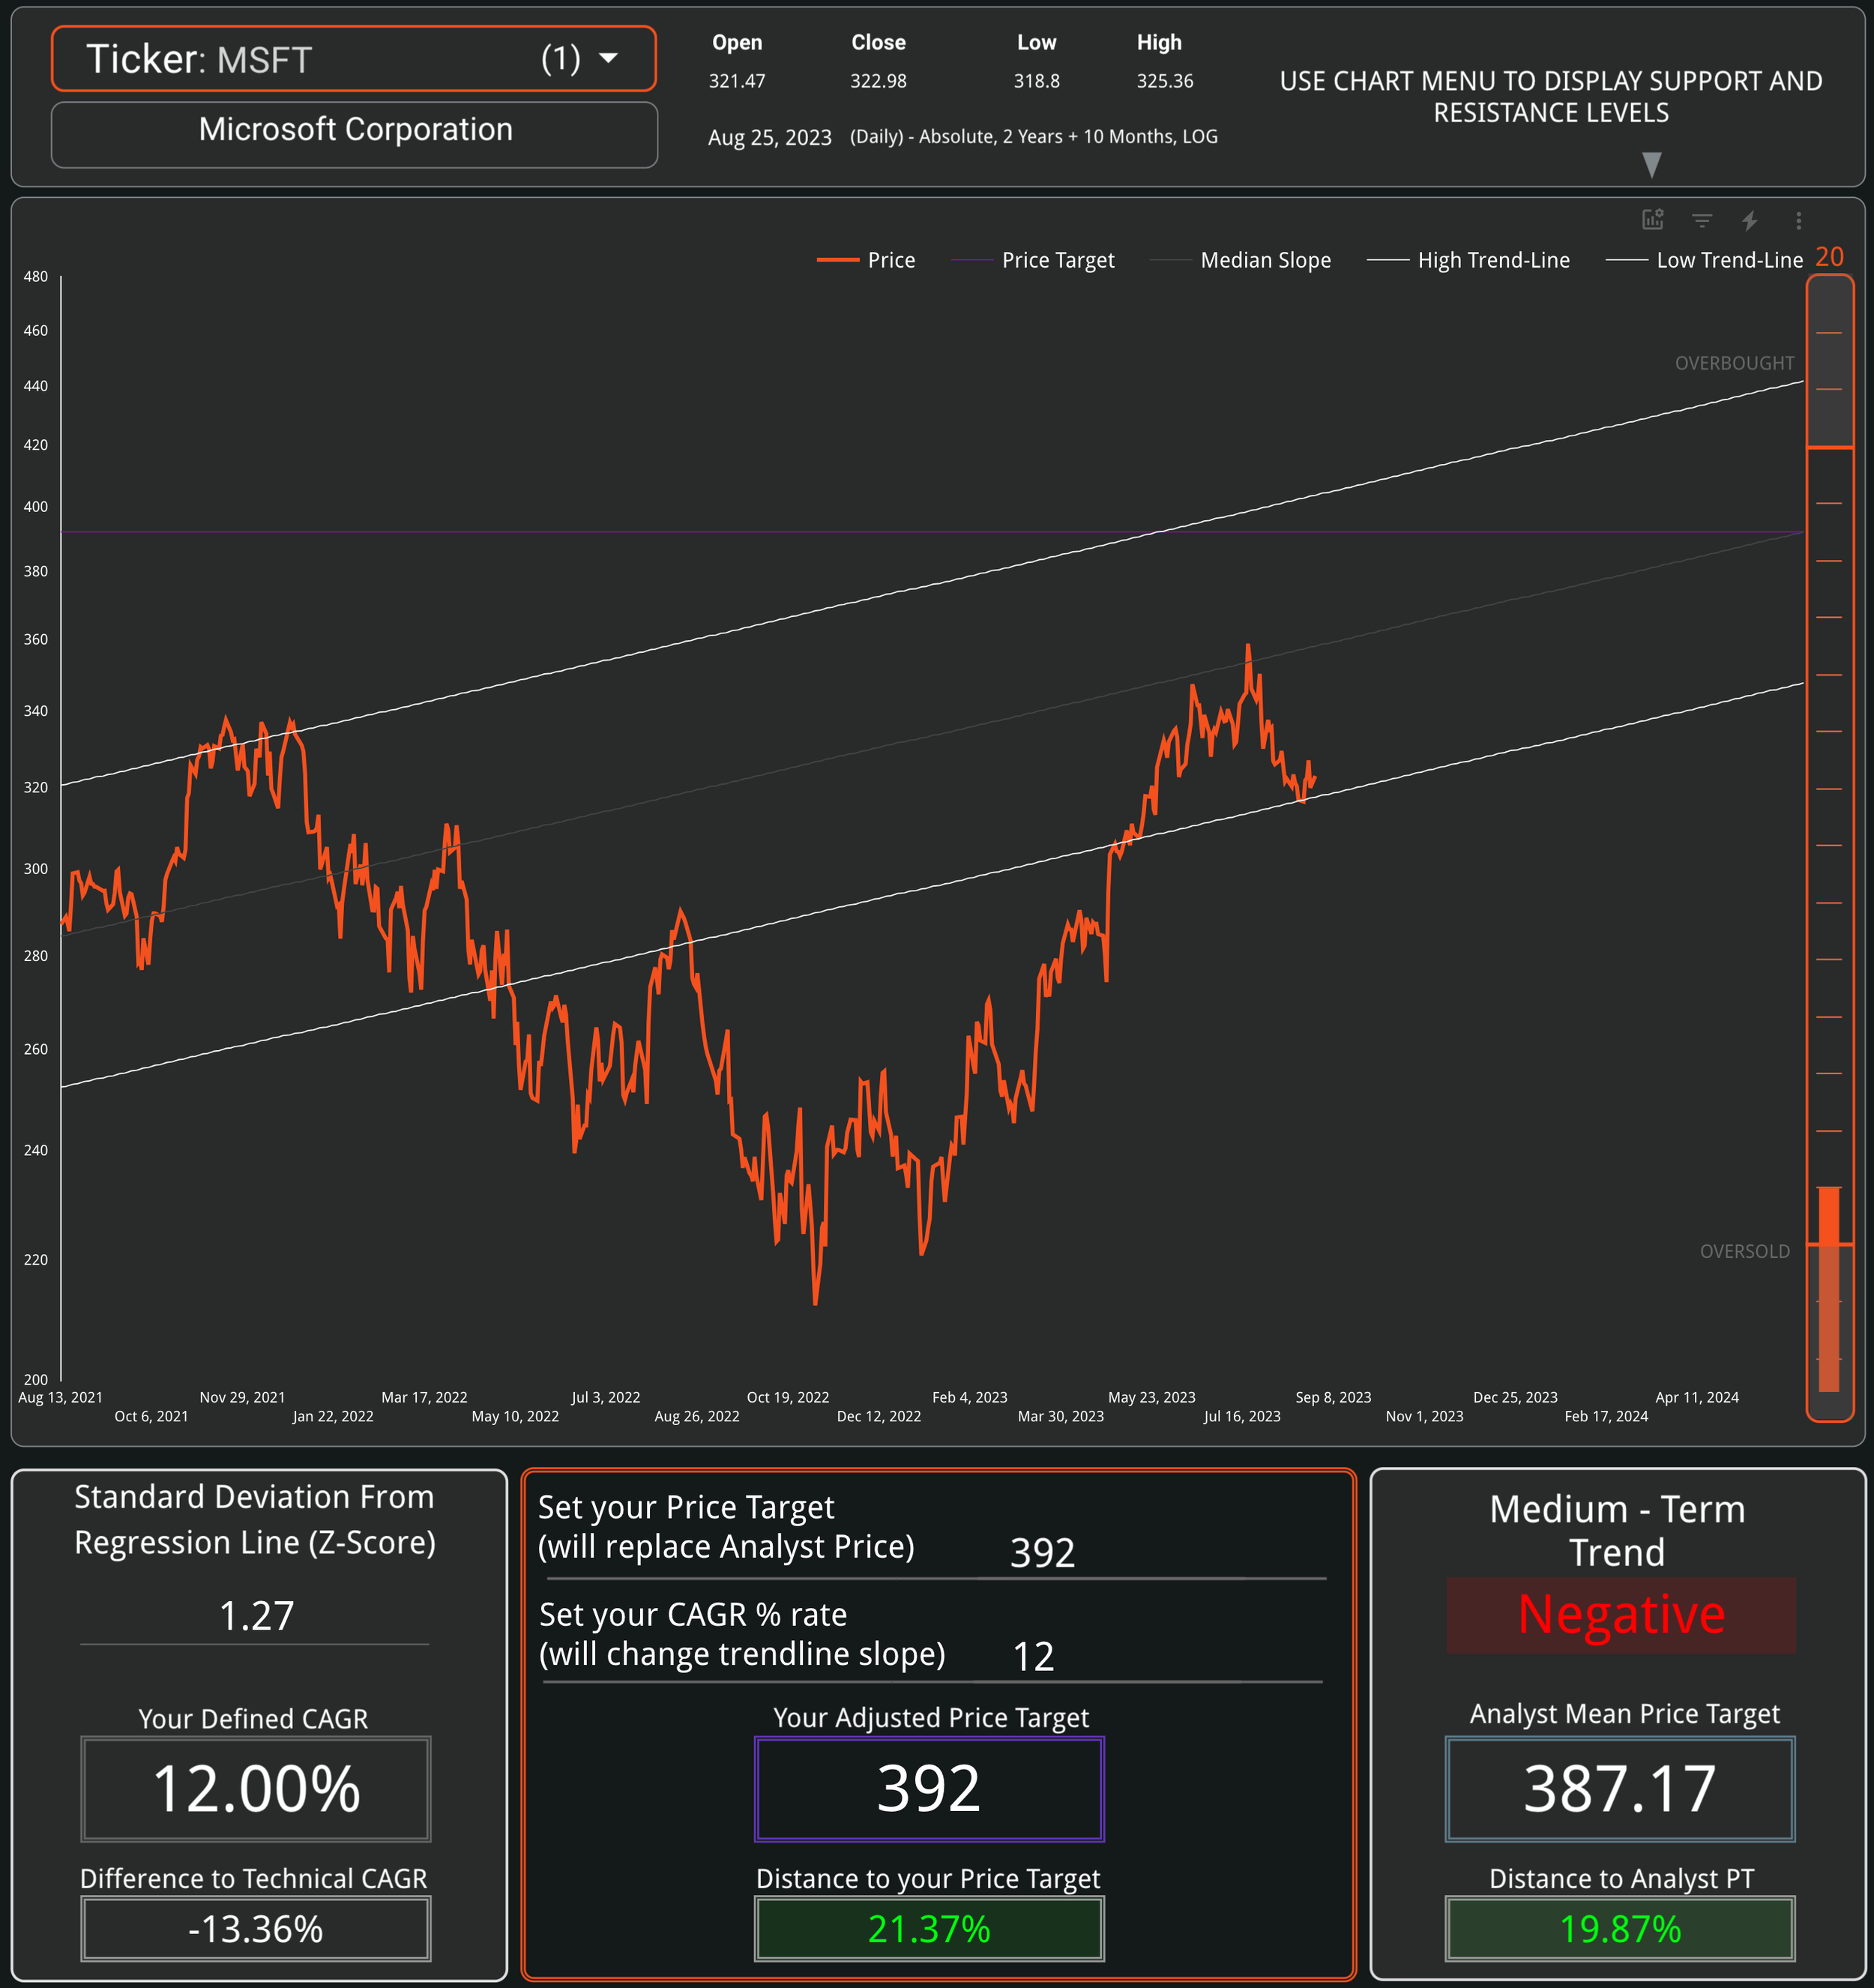
Microsoft Corp. (MSFT)
Signal Sigma PT: $392 (Raise from $350)
Analyst PT: $355
Upside: 22.51%
Rating: BUY
Assumptions:
12% Revenue Growth
68% Gross Margins
27% OpEx pct Sales
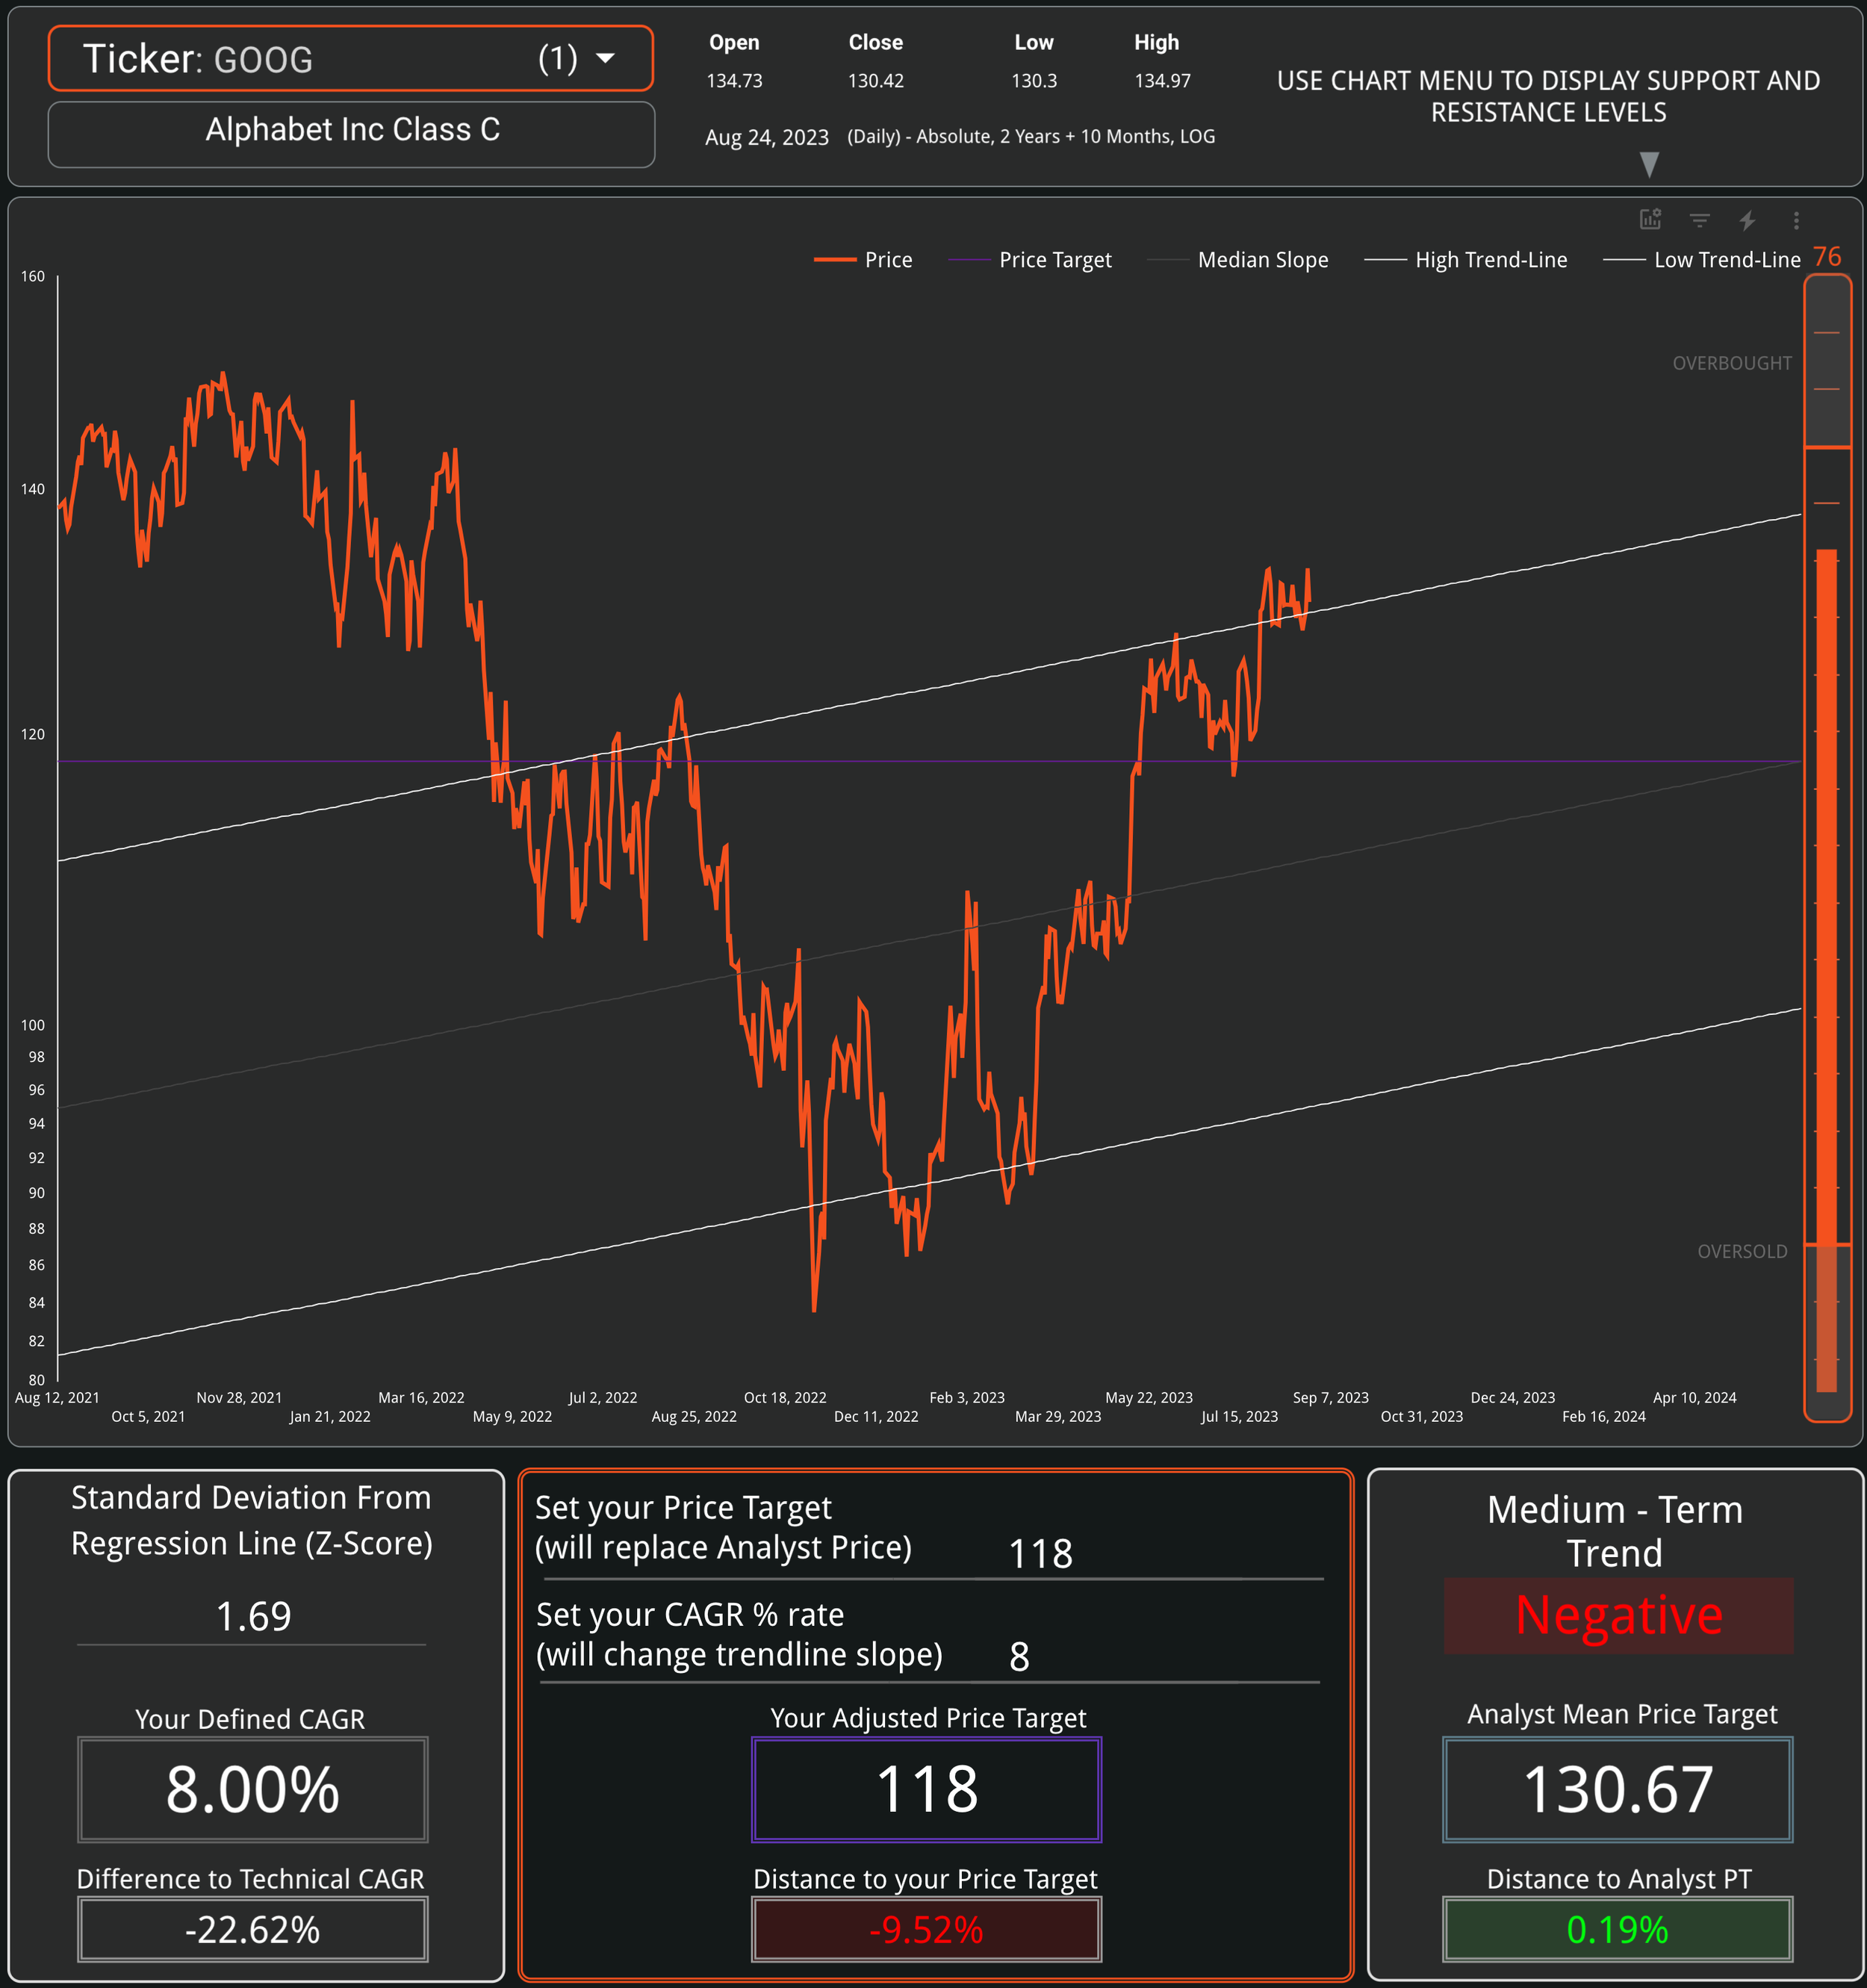
Alphabet Inc. Class C (GOOG)
Signal Sigma PT: $118 (Raise from $117)
Analyst PT: $130
Downside: 9.52%
Rating: HOLD
Assumptions:
9% Revenue Growth
53.5% Gross Margins
30% OpEx pct Sales

NVIDIA Corporation (NVDA)
Signal Sigma PT: $570 (Raise from $476)
Analyst PT: $524
Upside: 20.65%
Rating: HOLD
Assumptions:
34% Revenue Growth
60% Gross Margins
30% OpEx pct Sales

Tesla, Inc. (TSLA)
Signal Sigma PT: $236
Analyst PT: $239
Upside: 2.59%
Rating: BUY
Assumptions:
24% Revenue Growth
20% Gross Margins
7% OpEx pct Sales

Meta Platforms, Inc. Class A (META)
Signal Sigma PT: $242
Analyst PT: $363
Downside: -5.14%
Rating: BUY
Assumptions:
11% Revenue Growth
78% Gross Margins
50% OpEx pct Sales

Broadcom Inc(AVGO)
Signal Sigma PT: $785
Analyst PT: $883
Downside: -7.84%
Rating: BUY
Assumptions:
7% Revenue Growth
73% Gross Margins
18% OpEx pct Sales

Oracle Corporation (ORCL)
Signal Sigma PT: $110
Analyst PT: $124
Downside: -5.22%
Rating: SELL
Assumptions:
14% Revenue Growth
74% Gross Margins
43% OpEx pct Sales

Adobe Systems Incorporated (ADBE)
Signal Sigma PT: $495
Analyst PT: $555
Downside: -5.73%
Rating: BUY
Assumptions:
12% Revenue Growth
88% Gross Margins
52% OpEx pct Sales
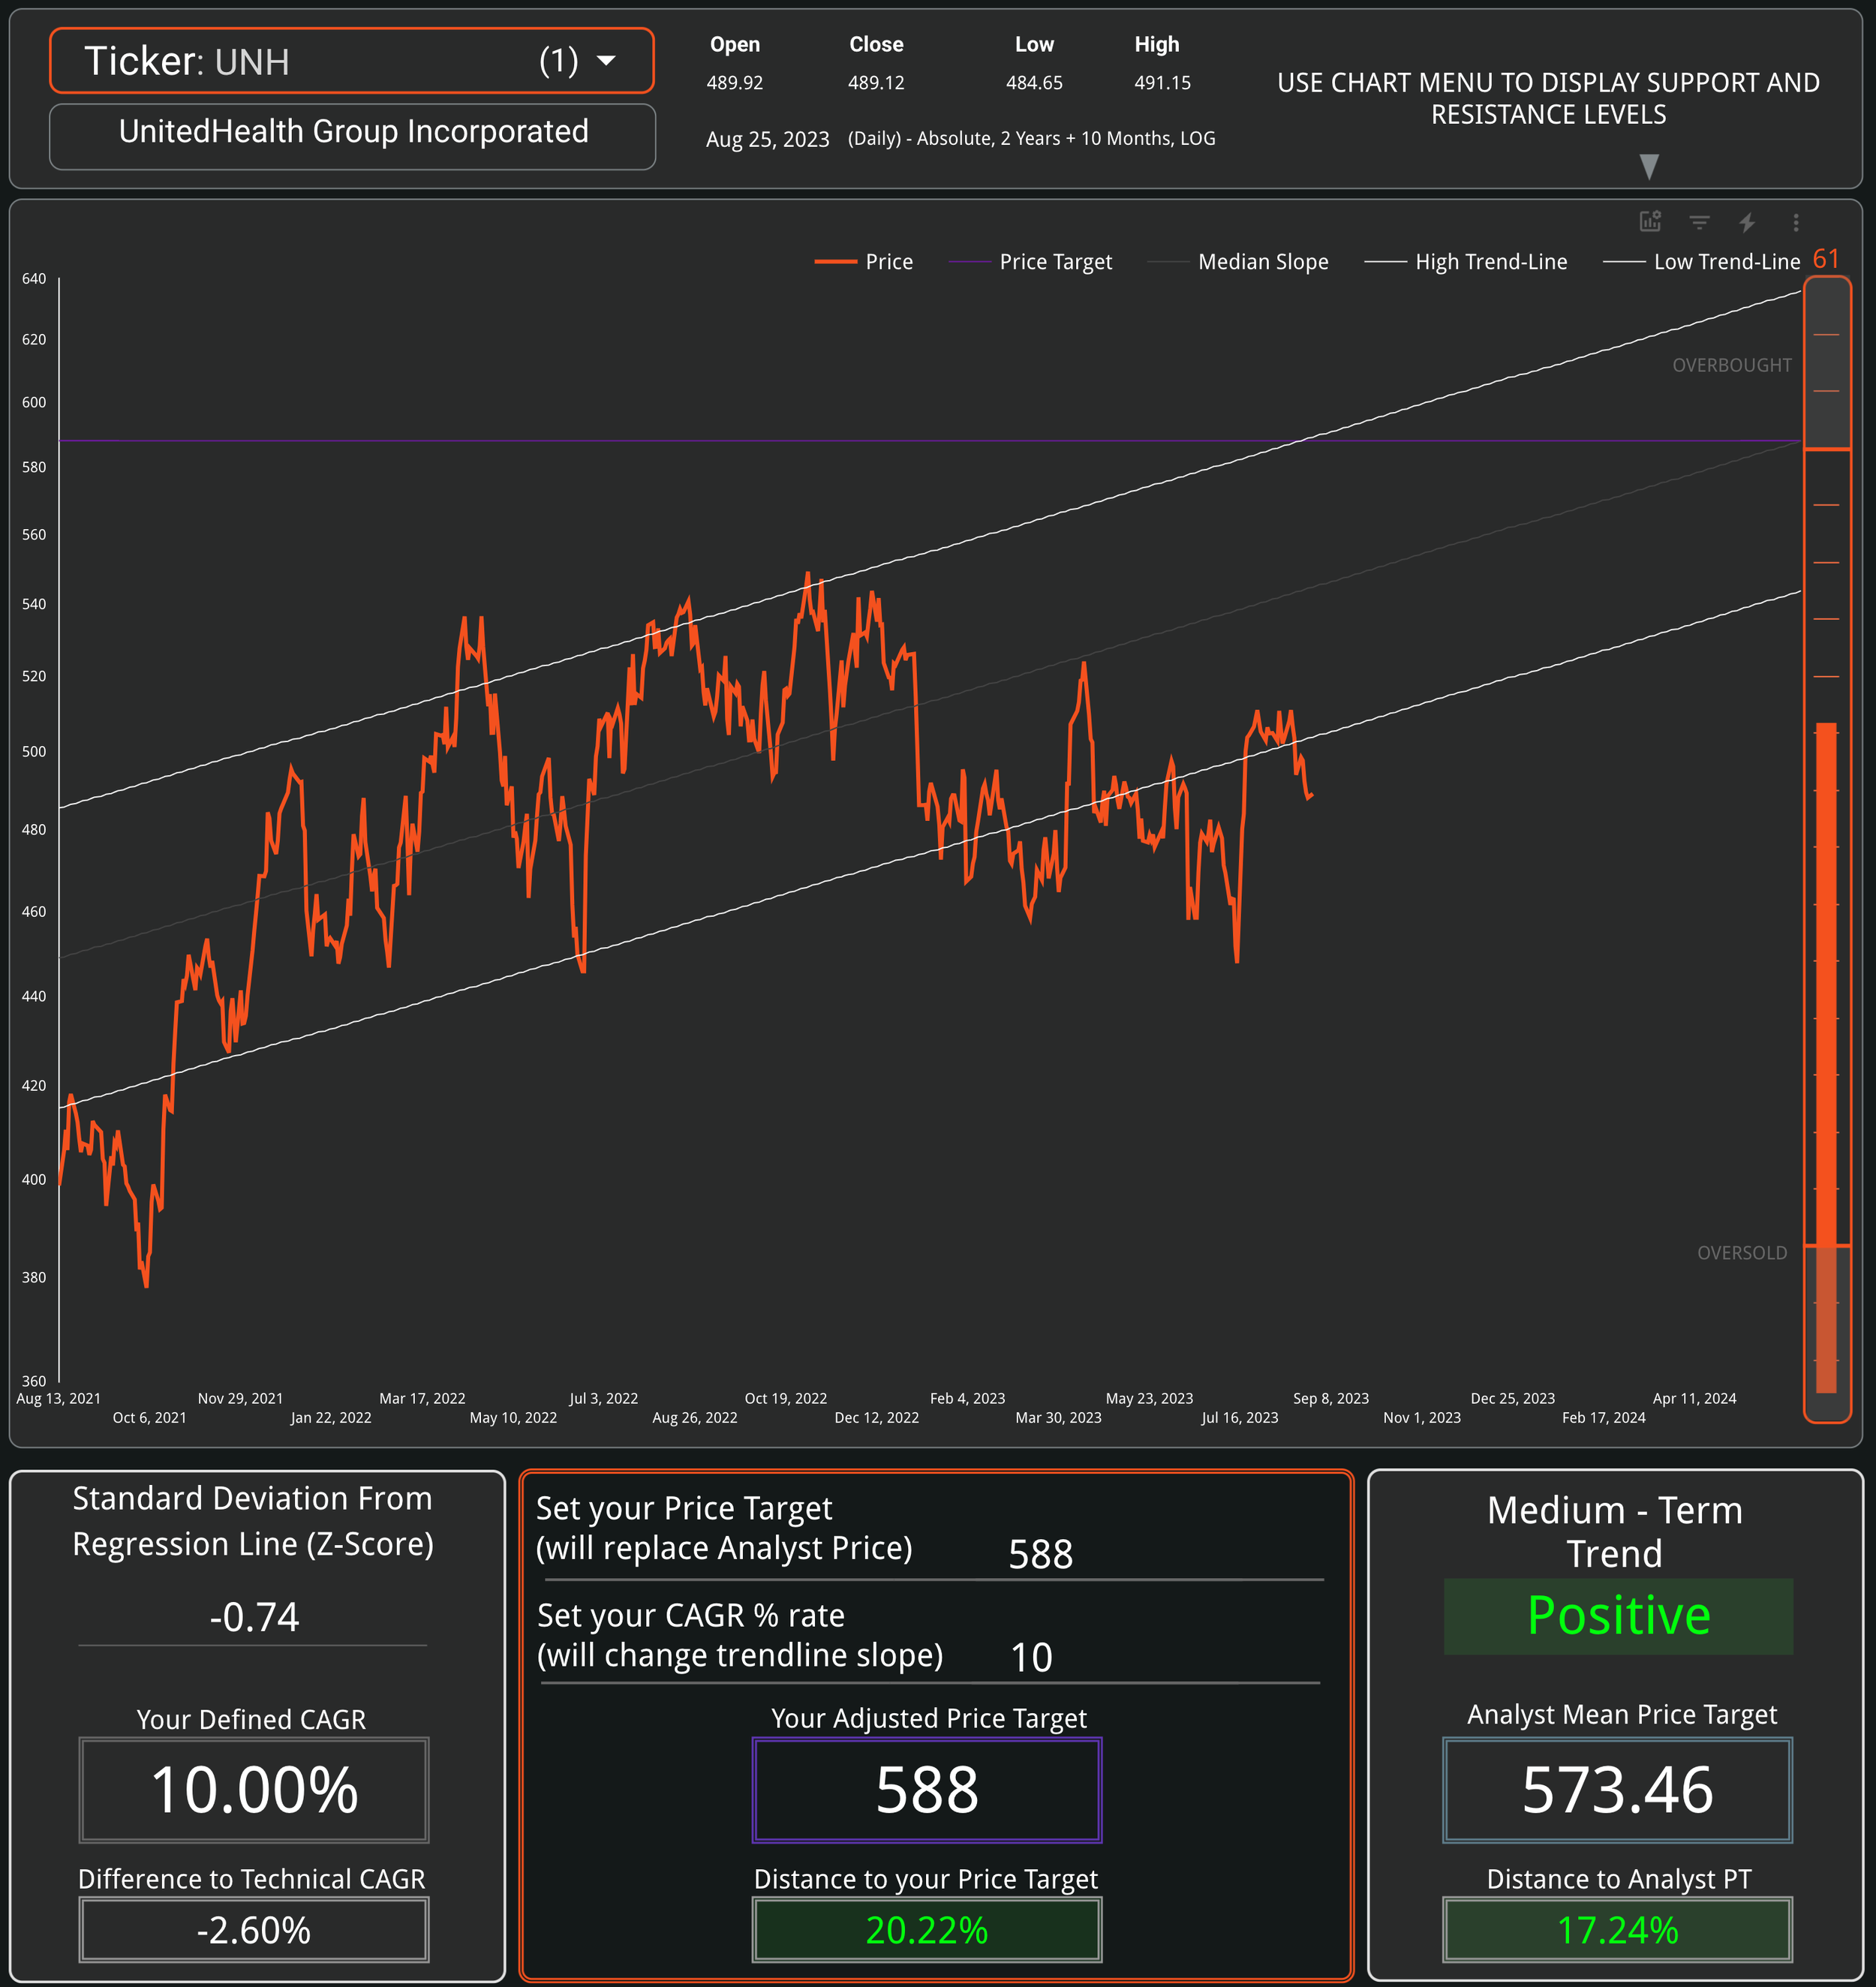
Unitedhealth Group Inc (UNH)
Signal Sigma PT: $588
Analyst PT: $573
Upside: 20.22%
Rating: BUY
Assumptions:
8.6% Revenue Growth
24.3% Gross Margins
16.2% OpEx pct Sales
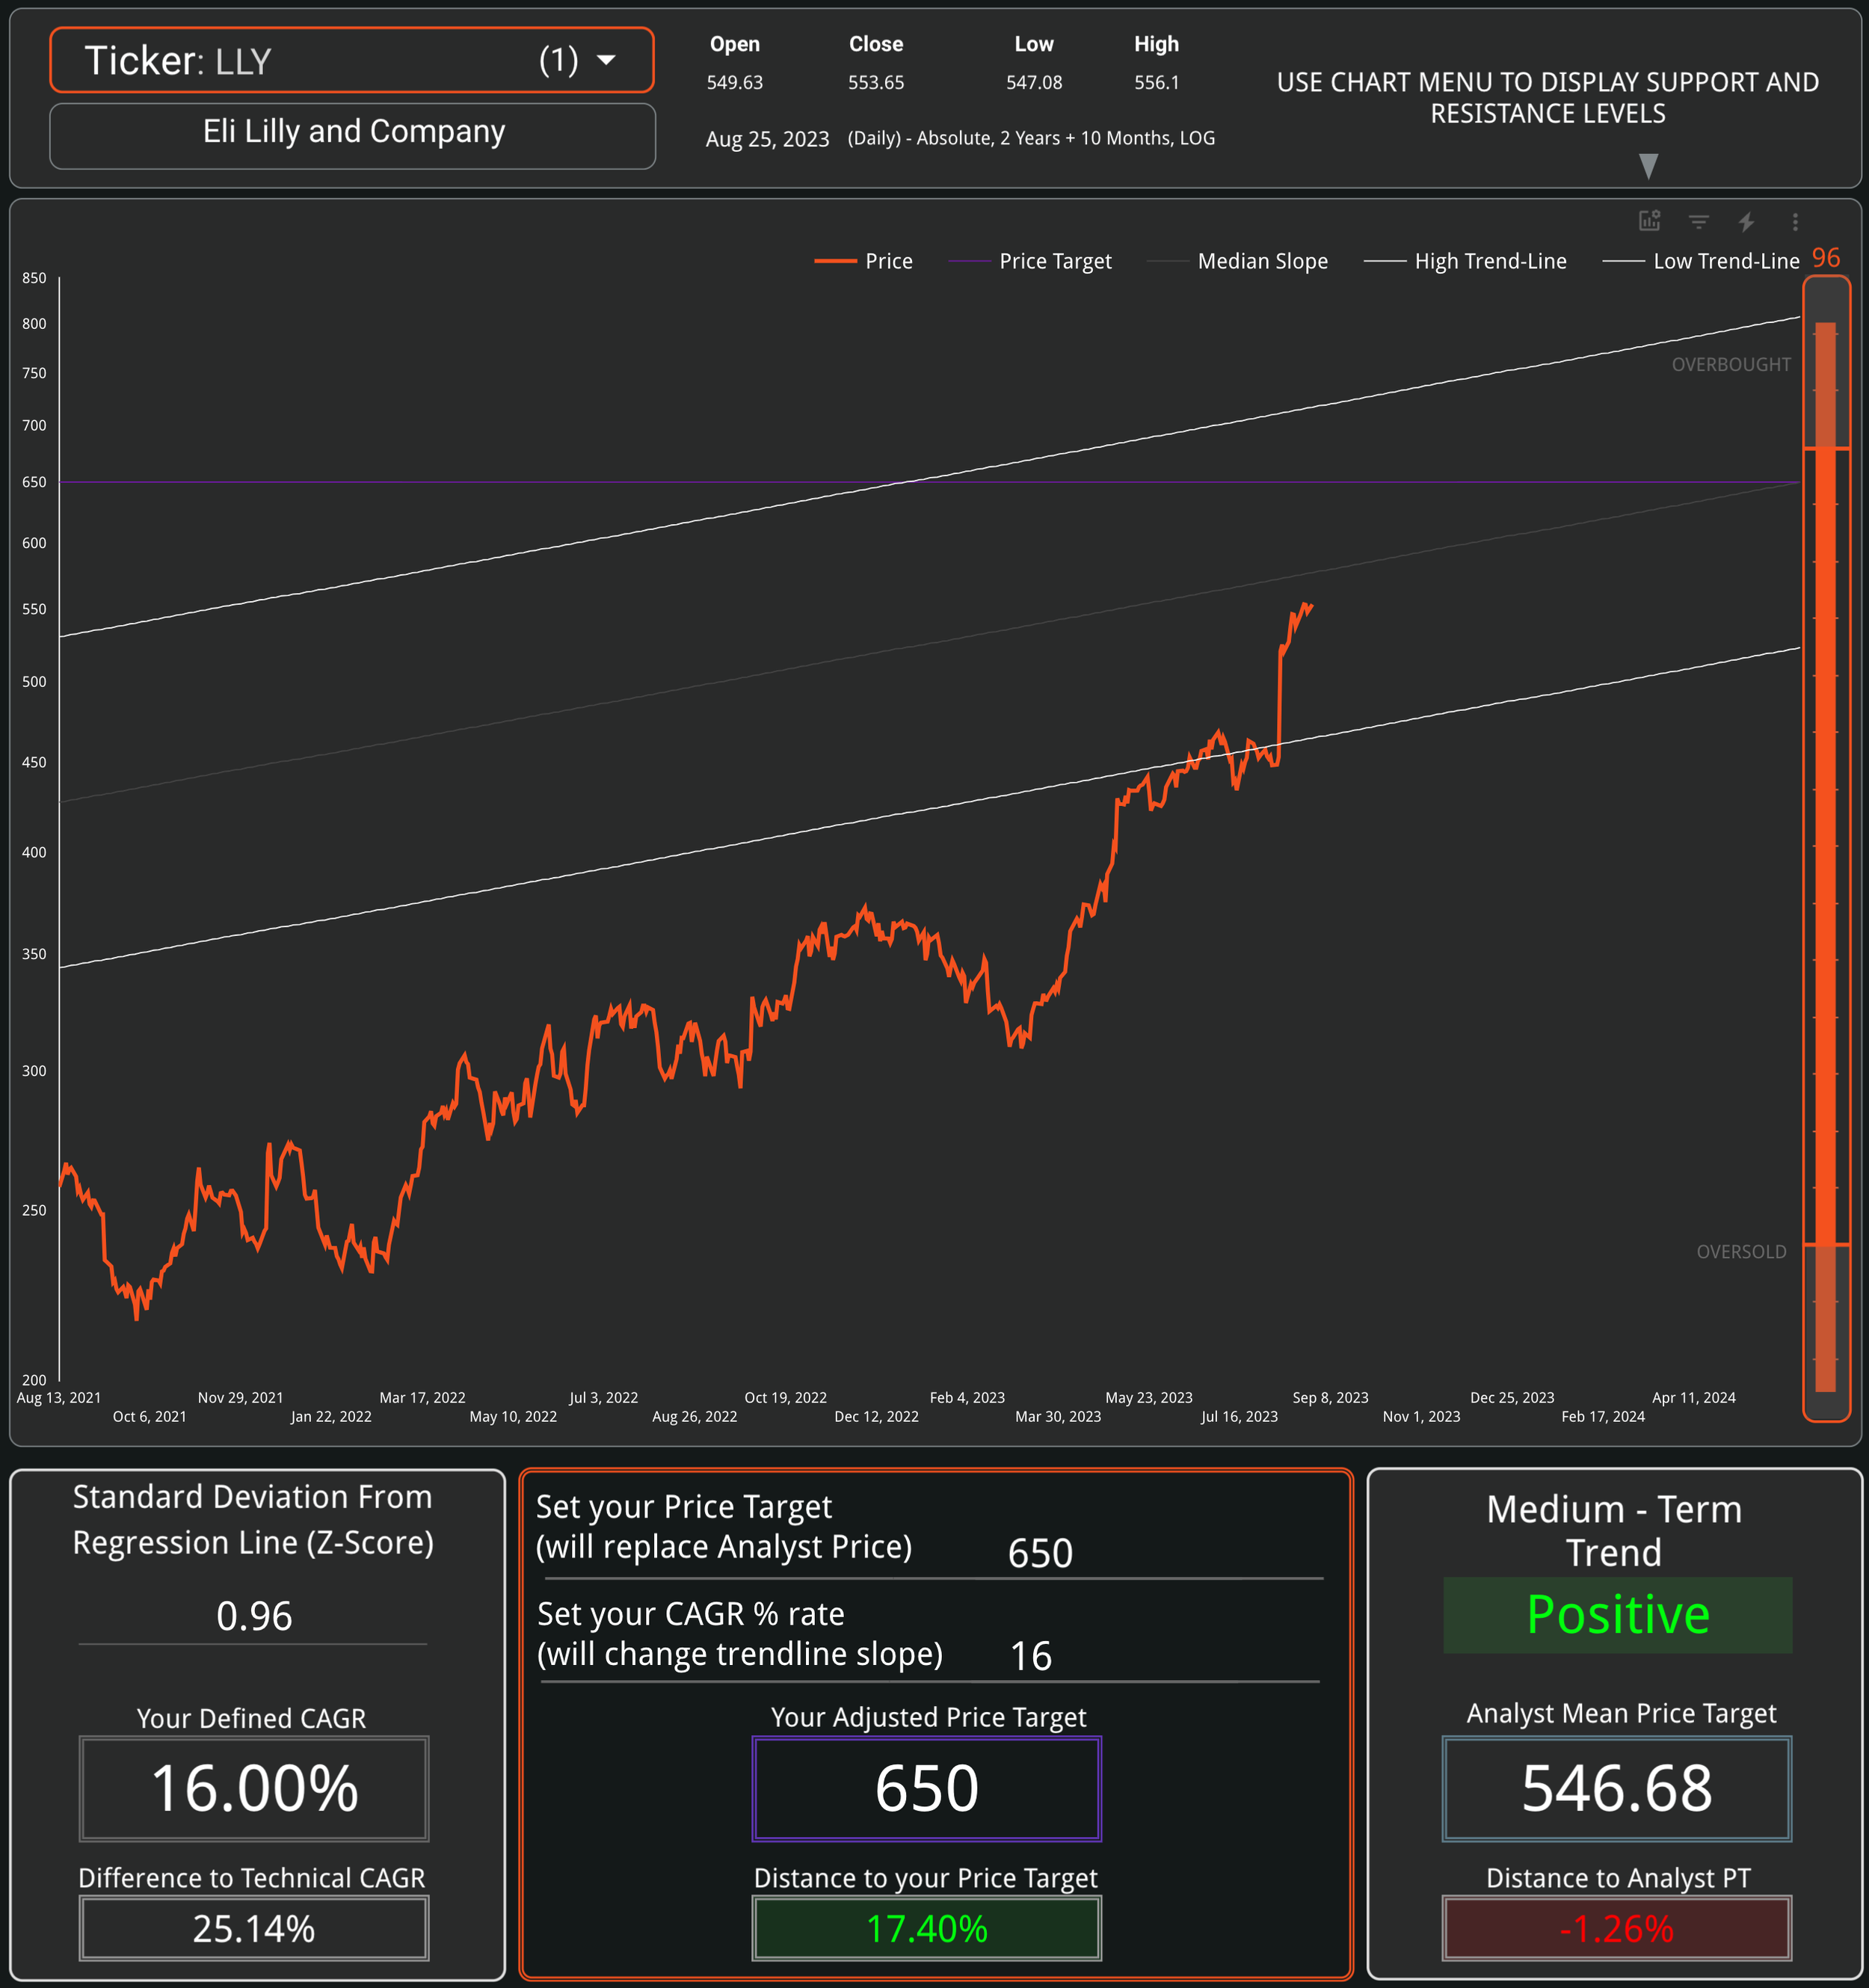
Eli Lilly & Co (LLY)
Signal Sigma PT: $650
Analyst PT: $546
Upside: 17.40%
Rating: BUY
Assumptions:
13% Revenue Growth
80% Gross Margins
47% OpEx pct Sales

Exxon Mobil Corp (XOM)
Signal Sigma PT: $124
Analyst PT: $122
Upside: 14.55%
Rating: HOLD
Assumptions:
3% Revenue Growth
63% Gross Margins
12% OpEx pct Sales

Johnson & Johnson (JNJ)
Signal Sigma PT: $163
Analyst PT: $184
Downside: -1.95%
Rating: HOLD
Assumptions:
2.8% Revenue Growth
65% Gross Margins
41.7% OpEx pct Sales

Procter & Gamble Co (PG)
Signal Sigma PT: $178
Analyst PT: $166
Upside: 15.93%
Rating: BUY
Assumptions:
3.6% Revenue Growth
49% Gross Margins
24.3% OpEx pct Sales
S&P 500 Valuation and Summary of Models
The conclusions of this article, as well as similar research are available to Signal Sigma Subscribers.
Sign up for free and see if our service is right for you. Cancel anytime, risk-free for 30 days.
This blog and the articles contained hereto should not be construed as an offer to sell, a solicitation of an offer to buy, or a recommendation for any security portfolio of securities, transaction or investment. Nor should it be construed as an endorsement of any particular investment or opinion of the stock’s current or future price. To be clear, I do not encourage or recommend for anyone to follow my lead on this or any other stocks, since I may enter, exit, or reverse a position at any time without notice, regardless of the facts or perceived implications of this article. I am not a financial advisor. At no point, do I provide any investment, legal, or tax advice or any recommendations, price targets, or opinions about valuation regarding the companies discussed herein. Any disclosures regarding my holdings are true as of the time this article is written, but subject to change without notice. I frequently trade my positions, often on an intraday basis. Thus, it is possible that I might be buying and/or selling the securities mentioned herein and/or its derivative at any time, regardless of (and possibly contrary to) the content of this article. I undertake no responsibility to update my disclosures and they may therefore be inaccurate thereafter. Likewise, any opinions are as of the date of publication, and are subject to change without notice and may not be updated. I believe that the sources of information I use are accurate but there can be no assurance that they are. All investments carry the risk of loss and the securities mentioned herein may entail a high level of risk. Investors considering an investment should perform their own research and consult with a qualified investment professional.
I wrote this article myself, and it expresses my own opinions. I am receiving no compensation for it, nor do I have a business relationship with any company whose stock is mentioned in this article. The information in this article is for educational purposes only and should not be regarded as investment advice or as a recommendation regarding any particular security or course of action.
The primary purpose of this blog/forum is to attract new contacts with professional industry expertise to share research and receive feedback (confirmation / refutation) regarding my investment theses.