Millennium Alpha Beats the S&P 500 by 20%
Our Flagship Stock Picking Model Outperforms
Signal Sigma Millennium is a stock picking system designed to stay fully invested in equities at all times. Since its asset class composition is nearly 100% stocks, a natural benchmark for such a model is the S&P 500 index. The strategy comes in 4 flavours:
Alpha (best performing)
Vol-Target (lowest risk)
Momentum (trend-following)
Vision (ARKK style unprofitable tech)
Our Alpha model hit an all-time-high on December 01 2023, beating the S&P 500 by 20.00% over a 2 year period. The excess sharpe generated by the model comes in at 2.00, with a statistical alpha of 12.40%. Over the same time period, the S&P 500 was essentially flat, up just 1.9%. In addition, the model’s drawdown during the 2022 bear market was less severe, exposing our clients to less risk than the benchmark index (-18.3% vs -21.3% for the S&P 500).
While the December ‘21 - October ‘22 period was marked by similar performance, a clear divergence starts forming as stock markets recovered into 2023. Over the 2 year period, our strategy generated 9.9% annualized returns.
Stock Picking Method and Rebalancing Schedule
Signal Sigma Millenium ranks stocks based on multiple metrics. 60, to be exact. After applying a transaction volume filter to the entire stock market universe, 1500 stocks are left to rank according to a couple of key factors:
Current Ratio
Debt Ratio
Return on Assets
Return On Invested Capital
Relative Z-Score - a proprietary Signal Sigma metric
Sharpe Ratio
Each stock is given a score of 1 - 1500 for every metric according to its ranking. Then, results are multiplied by the “importance” of every factor and finally added up. The top 15 stocks make up the final portfolio.
Positions are rebalanced every month according to this process. You can find each factor and approximate importance in the screenshot below.
The Current Portfolio
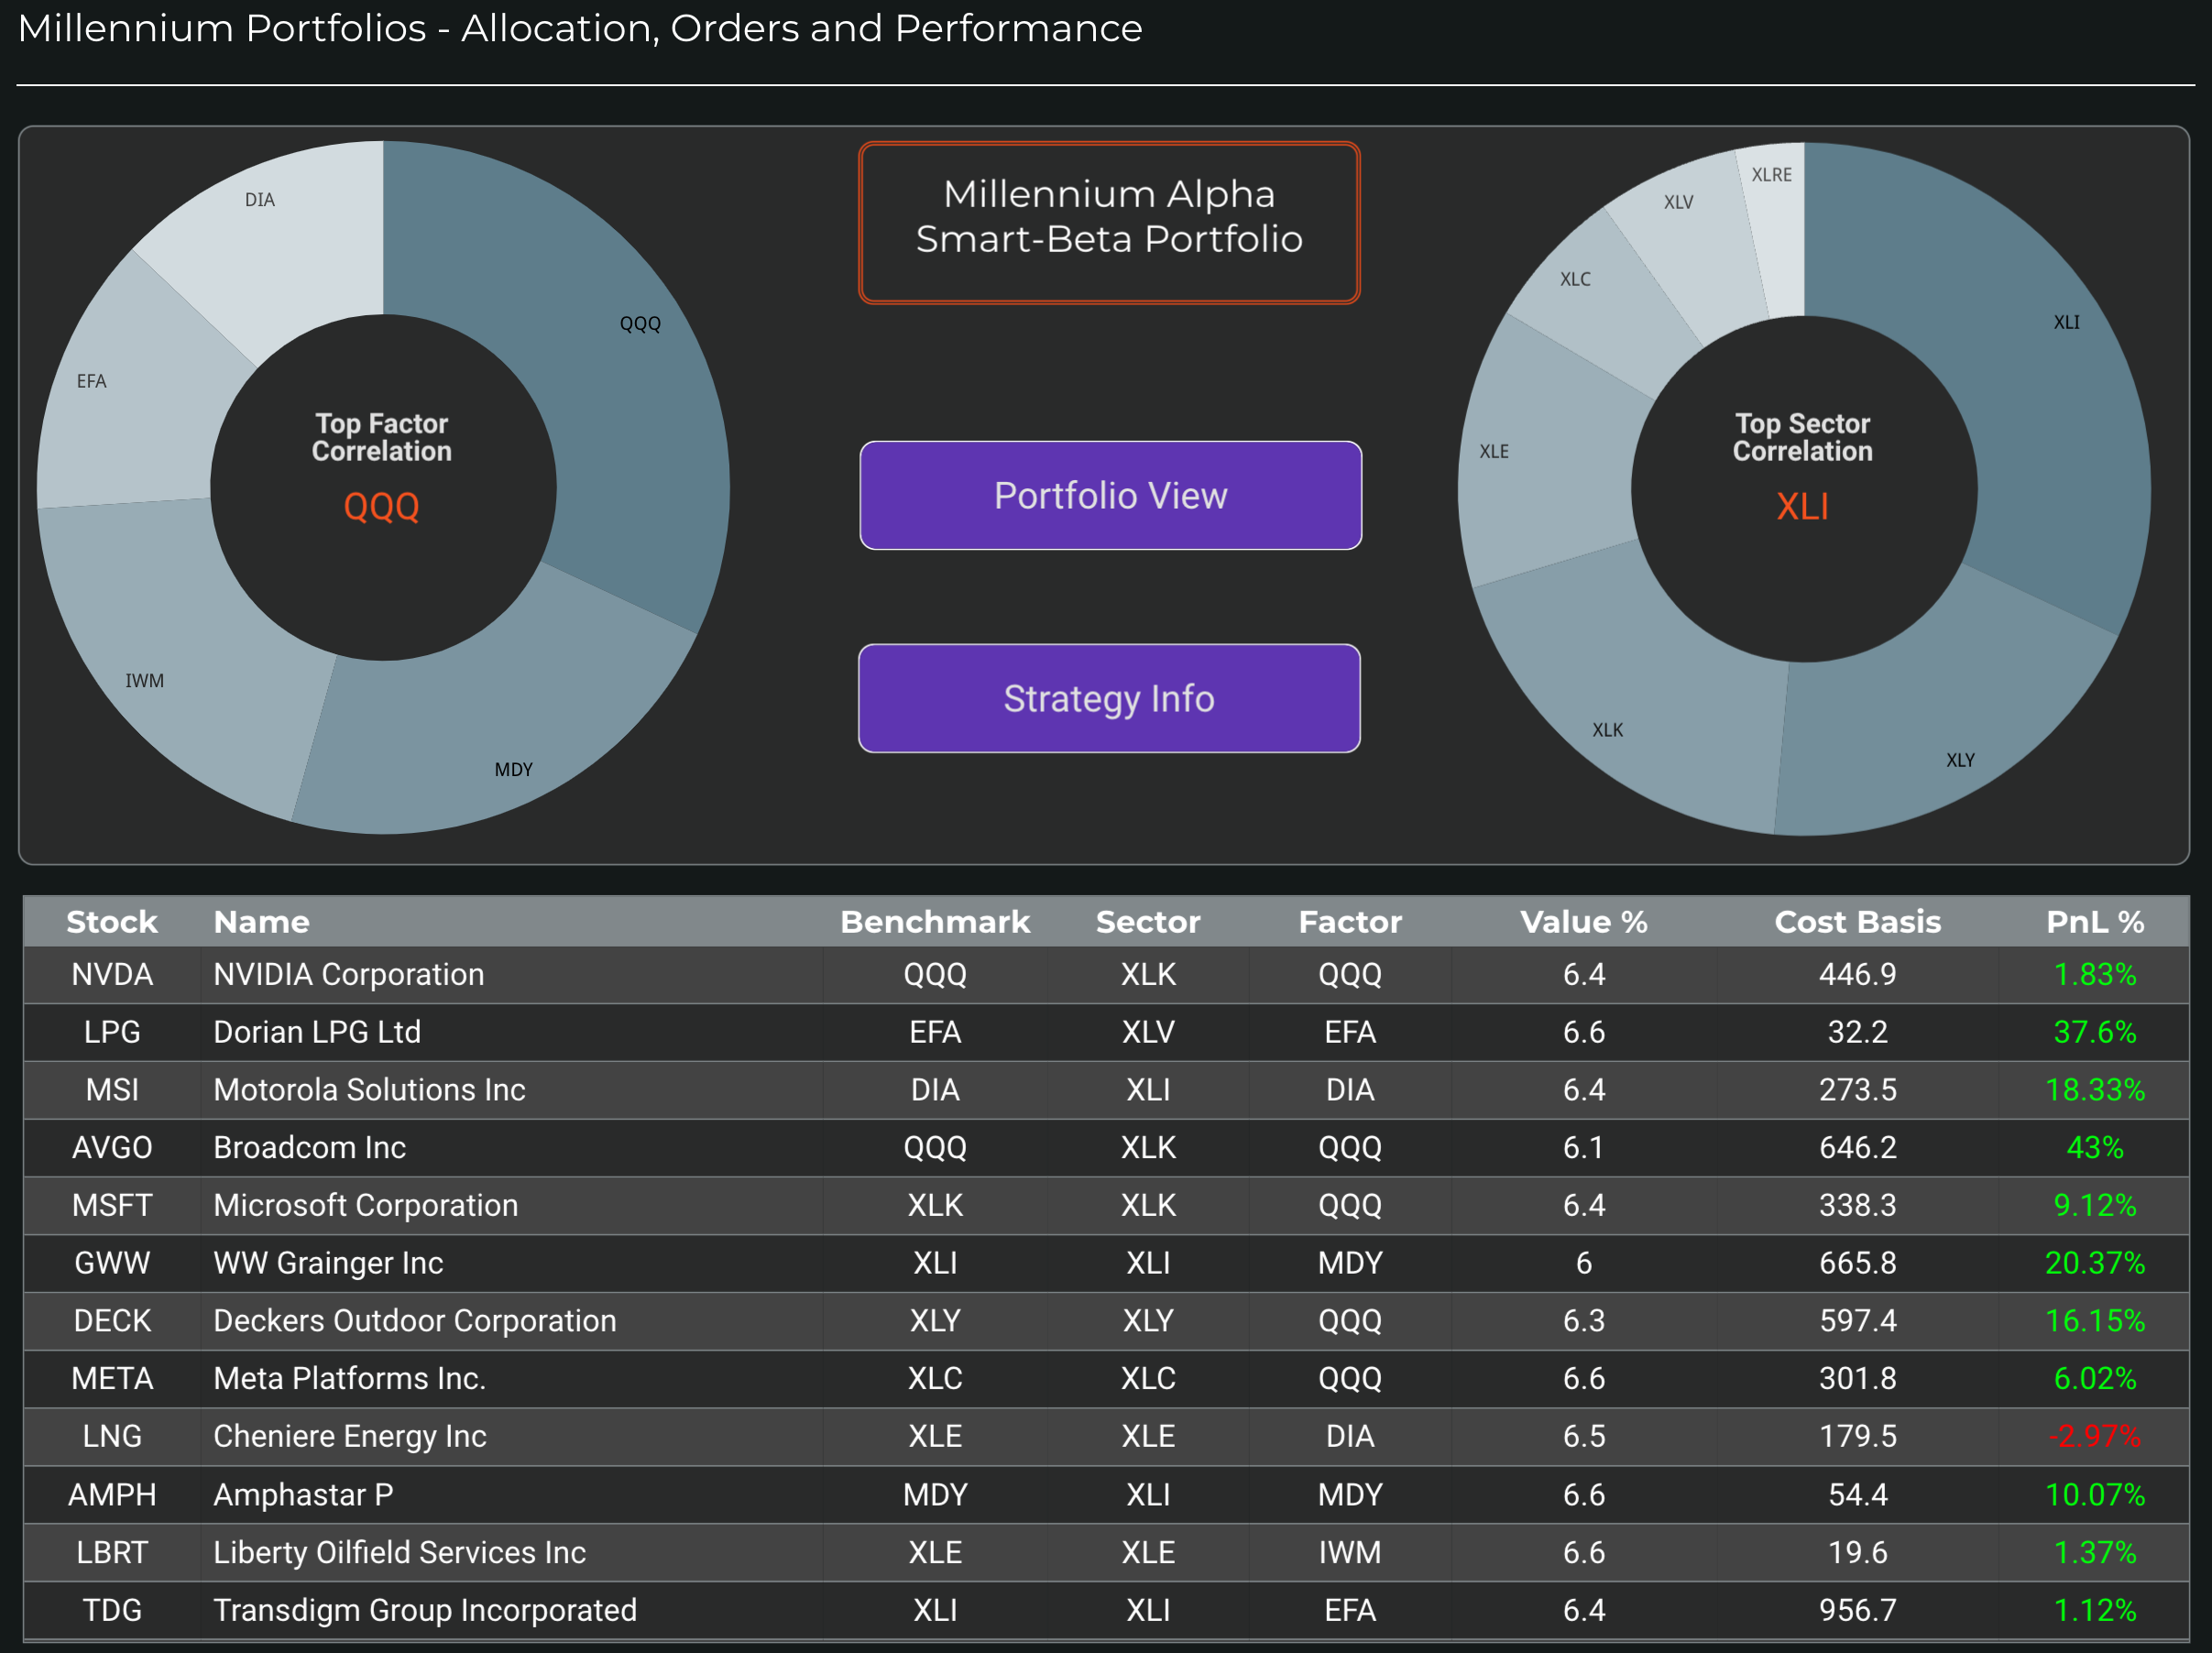
As of December 5, 2023, Millennium Alpha’s portfolio holds the following 15 names, equally weighted:
NVDA (NVIDIA Corporation)
LPG (Dorian LPG Ltd)
MSI (Motorola Solutions Inc)
AVGO (Broadcom Inc)
MSFT (Microsoft Corporation)
GWW (WW Grainger Inc)
DECK (Deckers Outdoor Corporation)
META (Meta Platforms Inc.)
LNG (Cheniere Energy Inc)
AMPH (Amphastar P)
LBRT (Liberty Oilfield Services Inc)
TDG (Transdigm Group Incorporated)
QLYS (Qualys Inc)
URI (United Rentals Inc)
FIX (Comfort Systems USA Inc)
In factor terms, the portfolio is highly correlated with Nasdaq (QQQ), Mid-Caps (MDY) and the iShares Russell 2000 ETF (IWM). From a sectors perspective, these stocks are mostly correlated with Industrials (XLI), Consumer Discretionary (XLY) and Tech (XLK).
Longer Term Performance
Long term performance for the Millennium Alpha model is stellar and sounds “too good to be true”. However, that’s what the math (and our backtests) say. Since 2007, excluding reinvested dividends, this model generated 18.20% annual returns, beating the S&P 500 by a wide margin and generating 21.30% statistical alpha.
Better yet, this model can be adjusted to your specific needs and risk-reward tolerance once you join one of our premium tiers. Even if you stick to our most affordable plan (priced at $25 / month) the investment ideas generated by such a model are well worth considering. Click here to see all of our available plans and features.
Signal Sigma Millennium Models are available on our Research Plan, starting at just $20.00 / month on an annual subscription.
Enjoy Our 30 Day Risk Free Trial
See if our Research Plan is right for you. Cancel anytime. 100% money-back guarantee.

Disclosures / Disclaimers: This is not a solicitation to buy, sell, or otherwise transact any stock or its derivatives. Nor should it be construed as an endorsement of any particular investment or opinion of the stock’s current or future price. To be clear, I do not encourage or recommend for anyone to follow my lead on this or any other stocks, since I may enter, exit, or reverse a position at any time without notice, regardless of the facts or perceived implications of this article.
I am not a financial advisor. Nor am I providing any recommendations, price targets, or opinions about valuation regarding the companies discussed herein. Any disclosures regarding my holdings are true as of the time this article is written, but subject change without notice. I frequently trade my positions, often on an intraday basis. Thus, it is possible that I might be buying and/or selling the securities mentioned herein and/or its derivative at any time, regardless of (and possibly contrary to) the content of this article.
I undertake no responsibility to update my disclosures and they may therefore be inaccurate thereafter. Likewise, any opinions are as of the date of publication, and are subject to change without notice and may not be updated. I believe that the sources of information I use are accurate but there can be no assurance that they are. All investments carry the risk of loss and the securities mentioned herein may entail a high level of risk. Investors considering an investment should perform their own research and consult with a qualified investment professional.
I wrote this article myself, and it expresses my own opinions. I am receiving no compensation for it, nor do I have a business relationship with any company whose stock is mentioned in this article. The information in this article is for informational purposes only and should not be regarded as investment advice or as a recommendation regarding any particular security or course of action.
The primary purpose of this blog/forum is to attract new contacts with professional industry expertise to share research and receive feedback (confirmation / refutation) regarding my investment theses.