
-
Monday:
ISM Manufacturing PMI
---
Tuesday:
JOLTs Job Openings (7.13M exp.)
---
Wednesday:
ISM Services PMI (54.8 exp.)
---
Thursday:
Initial Jobless Claims (195K exp.)
---
Friday:
Non Farm Payrolls (65K exp.)
Unemployment Rate (4.2% exp.)
Michigan Consumer Sentiment Prel.
-
Monday:
Apple (AAPL)
Palantir (PLTR)
Vertex Pharmaceuticals (VRTX)
Onsemi (ON)
Roku (ROKU)
---
Tuesday:
AMD (AMD)
Shopify (SHOP)
Pfizer (PFE)
Arista Networks (ANET)
Amgen (AMGN)
---
Wednesday:
Uber (UBER)
Qualcomm (QCOM)
Arm Holdings (ARM)
AppLovin (APP)
McDonald’s (MCD)
---
Thursday:
Airbnb (ABNB)
Cloudflare (NET)
ConocoPhillips (COP)
Sony (SONY)
DraftKings (DKNG)
---
Friday:
Moderna (MRNA)
Oklo (OKLO)
Vistra (VST)
Enbridge (ENB)
Under Armour (UAA)
Tech Cracks Under AI Spending Pressure
Got a question about the markets, your investments, or a topic you’d like us to discuss in an upcoming article? We read every message and may feature your question in our daily write-ups!
Email: andrei@signal-sigma.com
Follow & DM on X: @signal_sigma
The AI bill came due last week in full force. The market suffered a “Meta-style” correction especially in the Tech space, as the reaction to Alphabet earnings was disappointing to say the least. Then came Intel on Friday, delivering a nasty plunge and taking down the S&P 500 below its 100-DMA, to its lowest close since September 16. On Friday alone, the Nasdaq Composite dropped 2.9%, and the Dow lost 1.1%.
Cash flow was the main culprit, not demand. Google Cloud more than doubled its revenue, but Alphabet posted negative free cash flow of $9.1 billion and recorded quarterly capital expenditures of $51.4 billion; the stock fell 12.6% on Thursday. Amazon’s AWS grew 39%, yet earnings missed expectations and capital spending was about $77 billion for the quarter. Intel plunged 28.6% on Friday after issuing a weak fourth-quarter outlook, and Caterpillar slid 9.3% on Thursday. Microsoft bucked the trend: Azure grew 48%, and the stock declined less than 2% over two days.
The issue is not whether AI works. It’s all about costs and — more importantly — who pays for it, especially at 5% Treasury yields.
The Fed held steady (3.75% - 4.00% benchmark rate), with a 10-2 vote. September PCE inflation came in at 3.6%, with core at 3.1%, and third-quarter GDP growth was 3.4%. Fed fund futures now imply an 85% chance of a rate hike in December. Wages were a bright spot, with the employment cost index rising +3.1%, a sign that energy inflation is not showing up in paychecks for now. The 10-year yield eased to 4.93% from 5.00% a week earlier, while Brent crude remained around $118.
Now for the part that headlines don’t usually cover: 10 out of 12 major Sector ETFs gained for the week. 8 of them are positive for the month. Perhaps the most astounding figure is that the median 1-Month gain across this ETF selection is +5.68%. Financials were responsible for that.
Weekly and Monthly Sector Returns
On the Factors side, the equal-weight S&P 500 (RSP) gained 0.8%, outrunning the cap-weighted index by 1.4 points. Almost all the losses occurred in technology and communication services, the two sectors that drive the AI capex trade.
The usual view is that the market’s broadening is a bullish development. That could be true. Howard Marks has long warned that the greatest danger is believing there is no risk and that mindset now pervades the defensive sectors investors hid in. We’ll watch whether the bid under the equal-weight index holds after Apple’s earnings and next week’s October jobs report. If it does, Friday was a rather violent rotation; if it doesn’t, it may be the beginning of something bigger.
When studying the historical relationship between SPY and RSP, we note a recent spike in RSP outperformance, currently at +1.67 standard deviations. This is a highly mean reverting series. In the past, similar extreme periods have been excellent places to add exposure to SPY and reduce it relative to RSP. That is to that the defensive trade holding up the equal weight index is starting to become stretched. The next rotation should favor growth stocks, as the relationship eventually normalizes. There is one caveat here: the duration of previous episodes tends to be around 2-3 months of extreme readings, so it’s not necessarily a short-lived predicament.
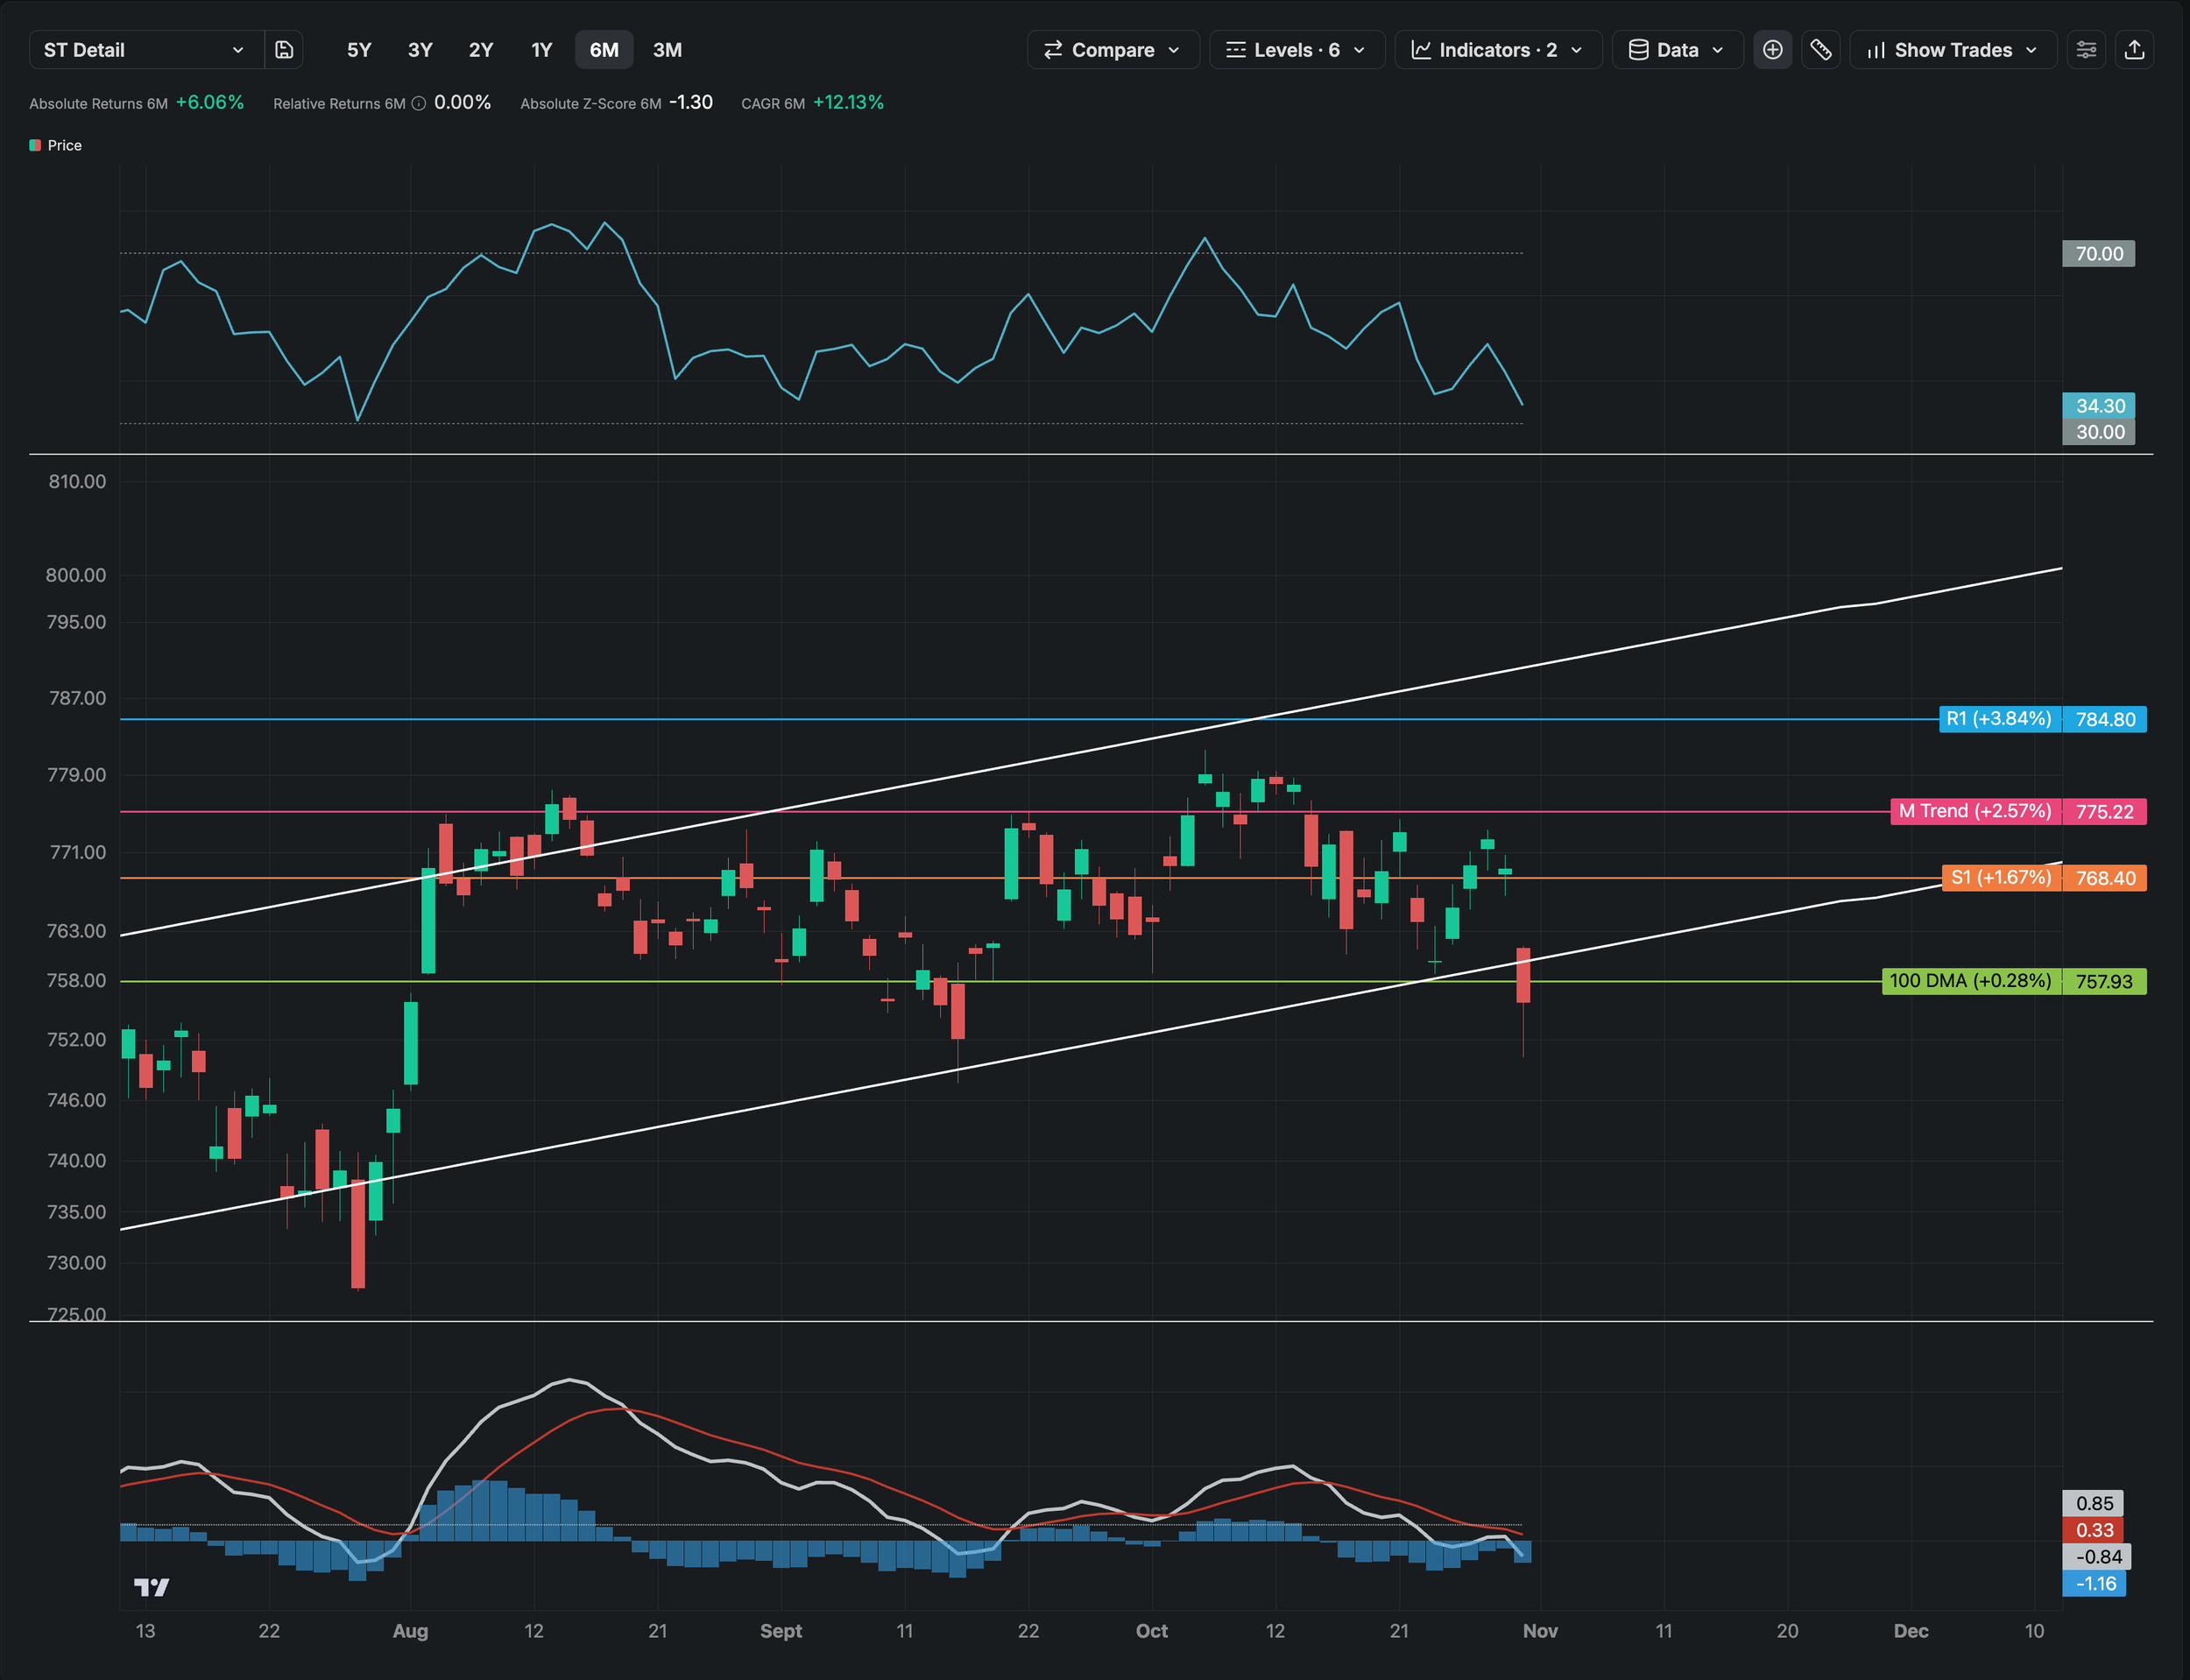
Technically speaking, it’s not a pretty picture. Friday did some real damage. SPY closed at $755, at similar levels to September 16. This is the first close below the 100-day moving average since early April. Now, the 100-DMA sits at a +0.28% upside, acting as resistance. Momentum confirmed the downside break, with RSO dropping from 48 on Wednesday to 34 at Friday’s close, nearing oversold. The MACD signal looked like it would turn up, but failed. The lower bollinger band at $757 was also breached. This band has acted as support since early June, with every break marking short term lows. There are no guarantees about this outcome, though. In March, SPY fell below the band 6 times across three and a half weeks before it ultimately found its low.
None of the above means that the bull trend is over. On a medium term horizon, the upward sloping 200-DMA remains supportive, and would be the next logical level of support. The 2Y trend is also positive, as is the 1Y and the 6-Month. The short-term, however, is starting to turn neutral and outright bearish if the 100-DMA cannot be reclaimed fast.
Sector breadth explains how the index declined even as most stocks rose. Versus the S&P 500, eight of 12 sectors sit more than 2.5% above their 50-day relative average: energy leads at +9.5%, followed by health care at +9.0% and consumer staples at +7.3%. Only technology (−3.9%) and communication services (−8.4%) trade meaningfully below that benchmark. The “safe” trade has become crowded as the groups that are oversold are exactly where any market rebound would need to begin.
There is a notable takeaway from the chart below that stacks a sector’s absolute Z-Score and relative-to-SPY Z-Score. Namely that defensives and energy are well and truly off the charts in terms of their performance (check out XLP below, which is trading near February high levels.). It’s hard to believe these sectors have room to run from here on out.
On the other hand, beaten down sectors like Industrials (XLI), Tech (XLK) and semiconductors (SMH) are not that oversold just yet. They show consolidation readings, rather than outright weakness.
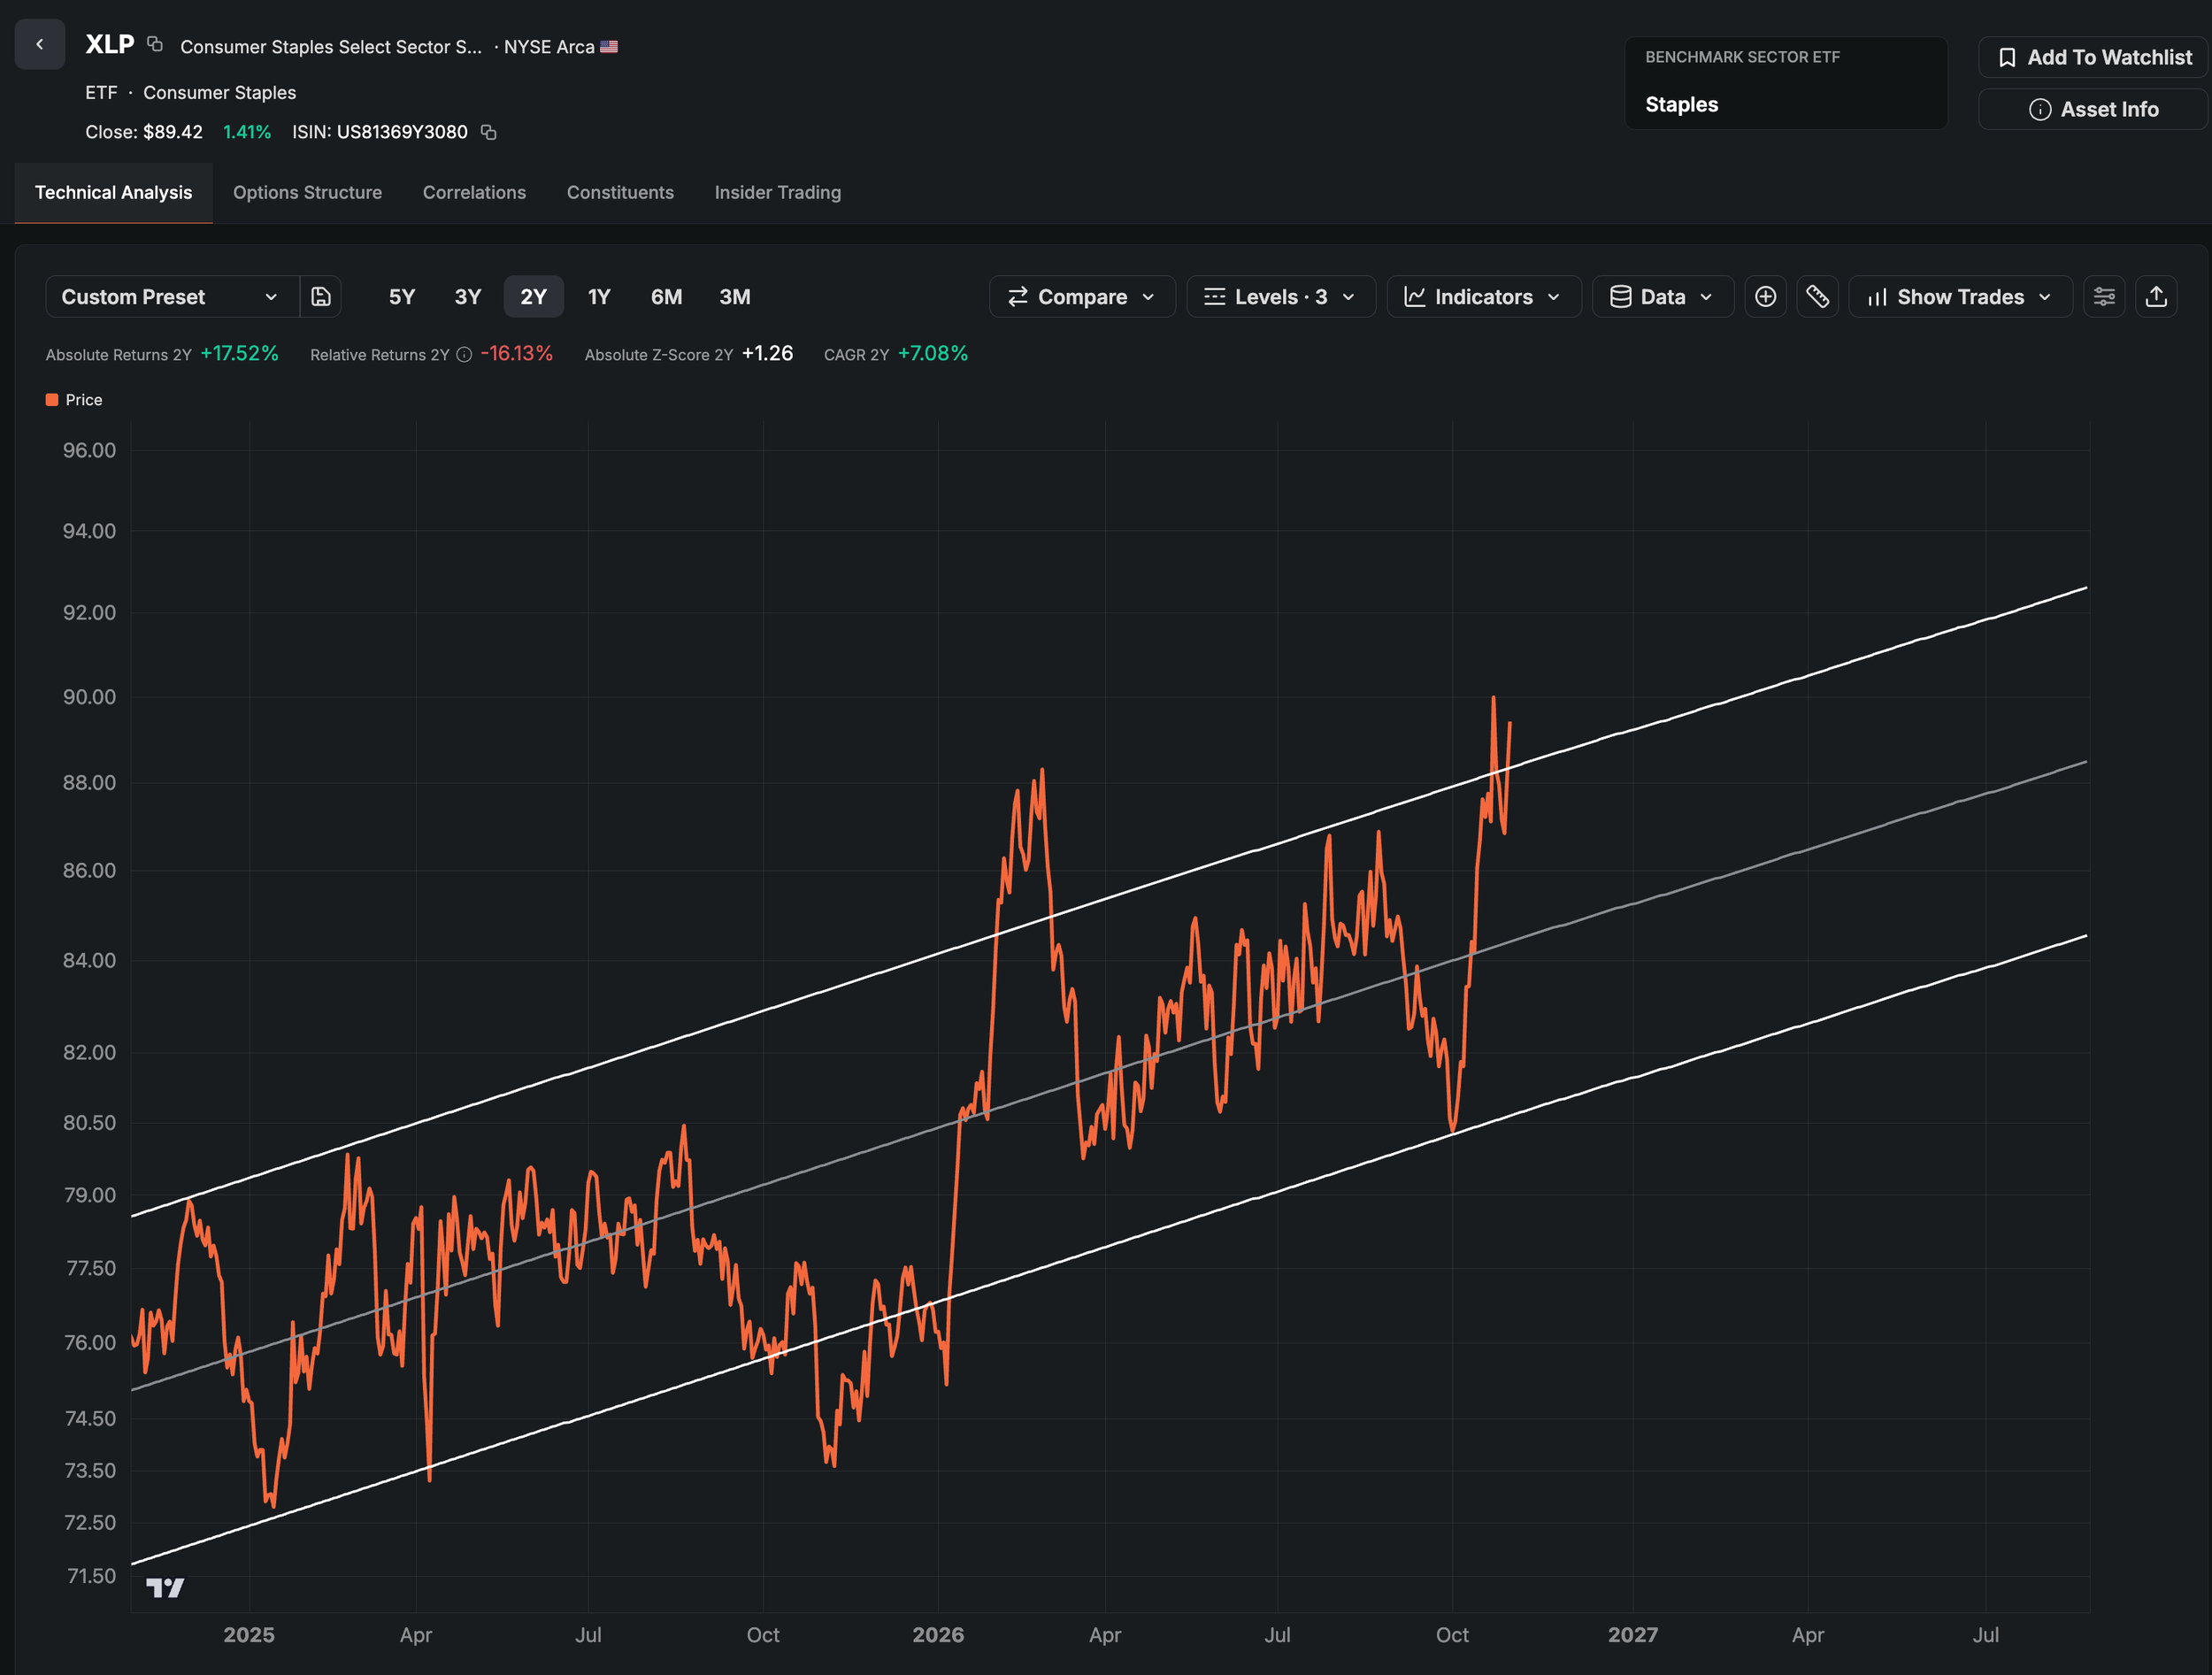
The point above cuts both ways. Since the key sectors that have provided leadership in 2026 are not clearly oversold, the market can move lower with them on further weakness. This is especially true as we’re trading in an extreme negative GEX regime, below keay moving averages, where investors tend to sell rallies and market makers amplify volatility. In this sense, Friday’s selloff is not an automatic buying opportunity.
An argument in favor of the bulls is the high institutional accumulation seen on Thursday and Friday. While the spike in Dark Pools nominal buying can be attributed to large overall volume, the Dark Pools index (measuring buying as a percent of total volume) remained high throughout the last 2 sessions of the week. This looks like opportunistic accumulation at favorable levels, while panic ensues in the options space.
Below zero, bonds hedge stocks. Above zero, they fall with stocks.
This week has the potential to be volatile in either direction. The issue with the current technical setup is that rallies are more likely to be sold rather than chased, as investors adjust exposure. A close above $757 by Friday’s close would turn the current episode into a textbook shake-out. Fail to reclaim the 100-DMA, and the market can end up 3-4% lower than current levels, where the 200-DMA and S1 levels reside. A close below these levels requires a more drastic adjustment of exposure.
Last week was certainly busy, and that’s also the case this week as well. Apple reports earnings later today, the midterm elections occur Tuesday, and the October jobs report is released Friday. Democrats are favored to win the House at roughly 94% odds and the Senate near 69%, according to Polymarket, but that’s already priced in.
The ISM manufacturing survey is forecast at 54.7 on Monday, with its prices-paid index around 78 in a sign that the energy-driven shock fueling this year’s inflation continues to ripple through supply chains and feed into corporate pricing.
Friday’s payrolls represent the key market-moving economic event. Consensus expects only 55,000–65,000 new jobs, with unemployment steady at 4.2%, and hourly wages rising 0.3%. A weak jobs print combined with 3.6% inflation would seriously call the Fed’s December rate hike into question.
On the earnings front, Palantir also reports on Monday, giving investors another look into the AI case. On Tuesday, AMD, Amgen, and Arista Networks report, followed by Qualcomm, Arm, and AppLovin on Wednesday. AMD and Palantir are the ones to watch, as they sit at the heart of the spending debate that hit Google and Amazon last week. If either can prove AI demand is converting into revenue rather than just driving expenses, the oversold chip and software stocks could rally sharply.
This is why we’re now seeing one of the highest potential upside readings in the options market since 2025 (almost matching the tariffs spike). The upside is there and it’s material, if the bears are proven wrong.
However, look at the lower side of the chart, which measures potential declines in the medium term. These are not nearly as low as the previous lows recorded in March 2026 or April 2025. In other words, the upside is there, but it’s far more expensive than before in terms of risk.
Our Trading Strategy (Sigma Portfolio)
What we’re seeing right now in the market is not a clean setup. Selling is not yet lopsided enough to signal that the bottom is in. There is ample fear manifested as concentrated positioning in defensives, yes, but that can also recede if the market bounces and fails to clear overhead resistance.
Energy is stretched and we can proceed to rebalance those positions back to target. However, adding to growth names at this stage is not a given. Yes, tech is oversold, but it may as well be a falling knife right now — one that we don’t want to catch. Oversold can always get more oversold.
If we were to add to growth names, we would do it in 2 tranches: one on a bounce and the second on a confirmation. We are also looking at clues from oil and yields. If both were to roll over convincingly, that would also help the case for a more risk-on posture.
As far as overall asset allocation is concerned, we will follow the Enterprise model for clues. We don’t expect any major surprises there, but tomorrow’s rebalancing event is the one to watch.
The asymmetry is clear. Defensives are crowded and growth was crushed but not knocked out. If oil and yields stop rising from already punishing levels, we could see a resurgence in the tech - semis - AI linked names. The bar is relatively low for this outcome to happen. But nothing is guaranteed and we know better than to call “the bottom”.
Disclosures / Disclaimers: This is not a solicitation to buy, sell, or otherwise transact any stock or its derivatives. Nor should it be construed as an endorsement of any particular investment or opinion of the stock’s current or future price. To be clear, I do not encourage or recommend for anyone to follow my lead on this or any other stocks, since I may enter, exit, or reverse a position at any time without notice, regardless of the facts or perceived implications of this blog post. I currently do not own or plan to own any position, long or short, in the securities mentioned.
I am not a financial advisor licensed in the United States. Nor am I providing any recommendations, price targets, or opinions about valuation regarding the companies discussed herein. Any disclosures regarding my holdings are true as of the time this article is written, but subject to change without notice. I frequently trade my positions, often on an intraday basis. Thus, it is possible that I might be buying and/or selling the securities mentioned herein and/or its derivative at any time, regardless of (and possibly contrary to) the content of this blog post.
I undertake no responsibility to update my disclosures and they may therefore be inaccurate thereafter. Likewise, any opinions are as of the date of publication, and are subject to change without notice and may not be updated. I believe that the sources of information I use are accurate but there can be no assurance that they are. All investments carry the risk of loss and the securities mentioned herein may entail a high level of risk. Investors considering an investment should perform their own research and consult with a qualified investment professional.
I wrote this blog post myself, and it expresses my own opinions. I do not have a business relationship with any company whose stock is mentioned in this blog post. The information in this blog post is for informational purposes only and should not be regarded as investment advice or as a recommendation regarding any particular security or course of action.
The primary purpose of this blog post is to share industry expertise and research and receive feedback (confirmation / refutation) regarding my investment theses.