
/ August 03 / Weekly Preview
-
Monday:
ISM Manufacturing PMI (54 exp.)
---
Tuesday:
JOLTs Job Openings (7.45M exp.)
---
Wednesday:
ISM Services PMI (54.5 exp.)
---
Thursday:
Initial Jobless Claims (201K exp.)
---
Friday:
Non Farm Payrolls (83K exp.)
Unemployment Rate (4.3% exp.)
Average Hourly Earnings YoY (3.5% exp.)
-
Monday:
Palantir Technologies Inc.
Vertex Pharmaceuticals Incorporated
---
Tuesday:
Space Exploration Technologies Corp.
Advanced Micro Devices, Inc.
Caterpillar, Inc.
Merck & Company, Inc.
Arista Networks, Inc.
---
Wednesday:
Eli Lilly and Company
Novo Nordisk A/S
Sandisk Corporation
Western Digital Corporation
Shopify Inc.
Uber Technologies, Inc.
Applovin Corporation
---
Thursday:
Toyota Motor Corp Ltd Ord
ConocoPhillips
Sony Group Corporation
Howmet Aerospace Inc.
---
Friday:
Berkshire Hathaway Inc.
Vistra Corp.
Take-Two Interactive Software, Inc.
Time To Buy The Dip In Momentum Stocks?
Got a question about the markets, your investments, or a topic you’d like us to discuss in an upcoming article? We read every message and may feature your question in our daily write-ups!
Email: andrei@signal-sigma.com
Follow & DM on X: @signal_sigma
The S&P 500 closed the past week up +1.08%, but that headline number hides nearly all of the trade which matters. Commentary from Zerohedge puts it eloquently:
“Despite a hopeful bounce to end the month, it was a bloodbath for most assets. It was the Nasdaq’s worst July in 22 years, bonds’ biggest July yield spike since 2005, and oil’s biggest July jump in over 30 years.”
While SPY and its Equally Weighted counterpart (RSP) have traded roughly unchanged for the past month, the Momentum Factor ETF (MTUM) fell -8.66%. Semiconductors, a key component of recent leadership, closed the month down -12.88%.
Index level strength remains. Both SPY and RSP are trading near all time highs, while stocks providing leadership within these ETF baskets were completely obliterated.
The long end of the curve was partly responsible for the historic unwind.
The 30-year Treasury ended Friday at 5.25%, up about 4 basis points, at its highest yield since 2007. Similarly, the 10-year climbed past 4.7%, its strongest level since January 2025. Both rises followed a sharp jump in oil amid renewed tensions in Iran, and came after the FOMC left the federal funds rate unchanged at 3.50%–3.75% for a fifth consecutive meeting.
Since the Fed now no longer employs “forward guidance”, rudderless bond traders are left to their own devices when it comes to pricing rates. Last week, they simply dumped treasuries on expectations of higher inflation driven by resurgent oil prices. Since the Fed was in no hurry to hike, the term premium was repriced accordingly.
The spike in yields primarily impacted rate-sensitive sectors Utilities (XLU) and Real Estate (XLRE), which fell -4.2% and -1.96% respectively. Consumer Discretionary (XLY) stood out with a +6.1% gain, but it was more of an Amazon story rather than a consumer story.
Within the mega cap complex, fortunes were split.
On Thursday, Microsoft jumped +15.5% while Meta slid -8.0%. On Friday, Amazon climbed +15.3% as Apple dropped -7.4%. Two straight sessions saw one megacap surge roughly +15% while another plunged -7% or more. Microsoft and Amazon reported strong cloud revenue growth that justified their capex, whereas Meta and Apple raised concerns.
On the economic data side, the bulls had something to cheer. Sort of.
Second-quarter GDP grew +1.5% against a +2.1% estimate. June core PCE fell -0.1% on the month and sits at +3.3% year over year. Both of these readings look disinflationary to us and should have tempered yields, especially at the long end. Instead, the 30-year yield printed a 19-year high.
The technical backdrop remains somewhat constructive, at least at the index level. Short and intermediate term MACD indicators are bearish, but the longer term trend is bullish. Critical support held at $738 (M-Trend) and the benchmark ETF managed to recapture the psychologically important 50-DMA by Friday’s close.
That reclaim, however, needs to last in order to count. Momentum snapped back hard, but the market is basically trading at similar levels to mid-May. This continues to be a market in consolidation and rotation mode, looking for the next decisive catalyst higher or lower. The only issue from a technical perspective is that, in the event of a breakdown, the potential downside (-8.0%) is much larger than potential upside (+3.4%). This presents an uncomfortable asymmetry for traders and investors.
On the plus side, Market Breadth is has been holding up remarkably well, with the number of stocks trading above key averages recovering nicely.
Last week, semiconductors fell -4.2% even as the broader index advanced. Micron slid -5.9% and SanDisk fell -5.1% on Friday, while the S&P rose +0.7%. Leadership is contracting, not expanding.
As a result, our buying regime indicator is now showing adverse conditions (green colored regime is off). The market tends to experience higher volatility, drawdowns and limited gains during such periods.
Jobs numbers are coming up this week, arriving at a sensitive moment for yields.
Three FOMC members voted for a rate increase on Wednesday, which completely captured the bond market’s attention. Fed Funds Futures are now pricing in a roughly a 63% chance of a September hike. The recent weakness in economic data is misaligned with the bond market’s reaction and it’s highly likely Friday’s July employment report will trigger a sharp reversal.
Heading into that report, the week will build up. The most notable event happens on Wednesday, in the guise of ISM Services. The services print matters more than usual because services inflation is what the FOMC dissenters keep citing. JOLTS job openings will give us a labor market preview on Tuesday, while Initial Jobless Claims will also be watched on Thursday.
Another area of interest should be the wage growth component of the employment report on Friday — more critical for inflation than the headline unemployment rate number. Payrolls came in weak in June and personal income already printed a weak number. Normally, this should point to sluggish average hourly earnings. This should reverse the move at the long end of the curve.
The earnings calendar is broadening beyond the mega caps as well.
Caterpillar reports Tuesday before the open — after a -21% decline since June 22, its release is the cleanest read on whether data-center construction is translating into equipment orders. AMD reports Tuesday after the close and is the week’s most consequential print for the AI hardware ecosystem. Memory makers SanDisk and Western Digital report Wednesday, with SanDisk entering the print down -44% from its June peak. Eli Lilly and Disney also report Wednesday morning.
All of these data points are critical to the question of buying the dip in momentum names. A cool wage number on Friday gives long term yields room to retreat, which is the fastest way to repair the damage done to momentum stocks.
With bonds already oversold on a medium and short term basis, the odds of a reversal are elevated. From a short term trading perspective, a contrarian bet on long duration bonds might very well make sense.
Related to the momentum trade, virtually all of our core strategies incorporate this factor in their stock selection in one way or another. The average retail investor’s portfolio has certainly taken a hit recently, similar to our strategies.
The momentum crash we just experienced was the quickest on record, concluding last Thursday when a $45 billion hedge fund sold its entire public equity portfolio to Citadel in one block trade. The selling was primarily mechanical, as leverage that fueled the move on the way up has almost completely unwound.
Morgan Stanley’s sector-neutral momentum index plunged -17.4% over four sessions, marking the largest four-day decline in the series’ history. By comparison, it fell about -11% after the dot‑com peak and during the 2022 inflation-driven bear market, and -14% following the Covid crash. The technology and media portion of the basket tumbled -36% in four days, far exceeding the previous record of roughly -20% set during the 1999–2001 unwind.
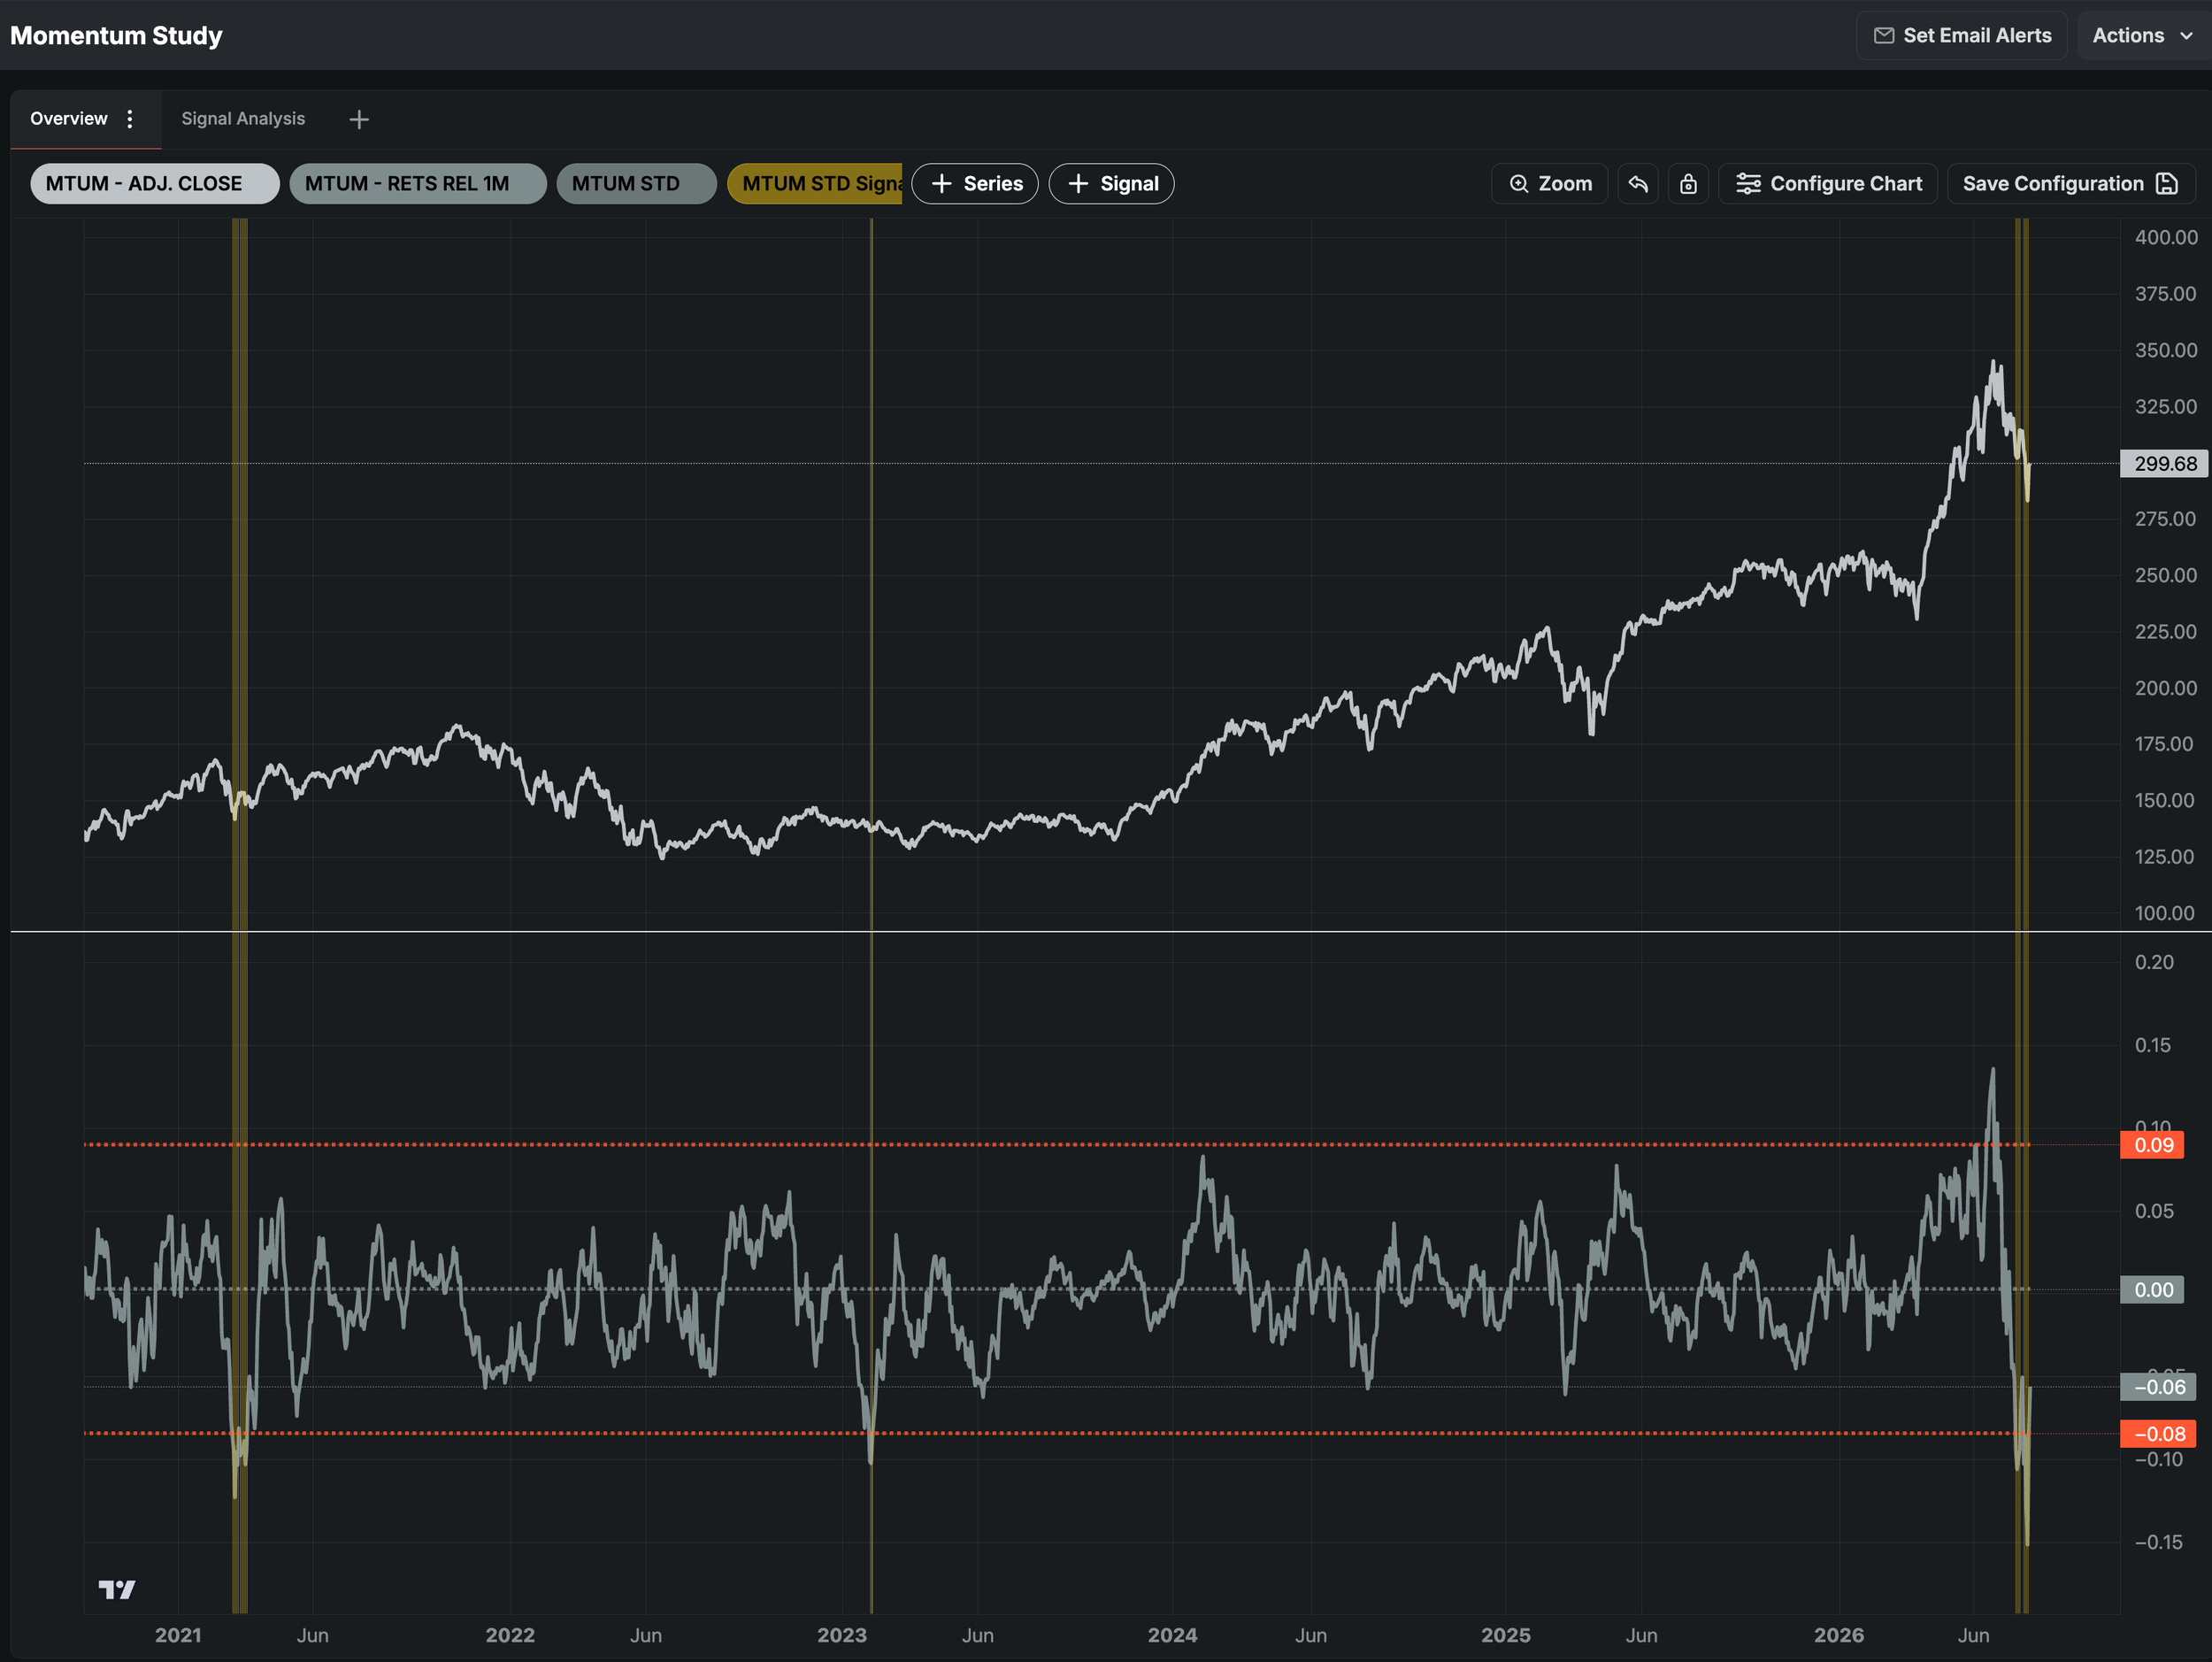
The Momentum Factor ETF (MTUM - study above) has recorded a 1-month relative to SPY return of -15% last Wednesday. This was the single largest such divergence since the ETF’s inception, well below -3.5 standard deviations in this series. In the context of SPY closing near a record high in the middle of this wreck, this is a fairly bullish signal overall.
While for many (including our Strategy followers) it may have felt like a crash - it was certainly not. Leveraged traders were liquidated and the market continues to rotate.
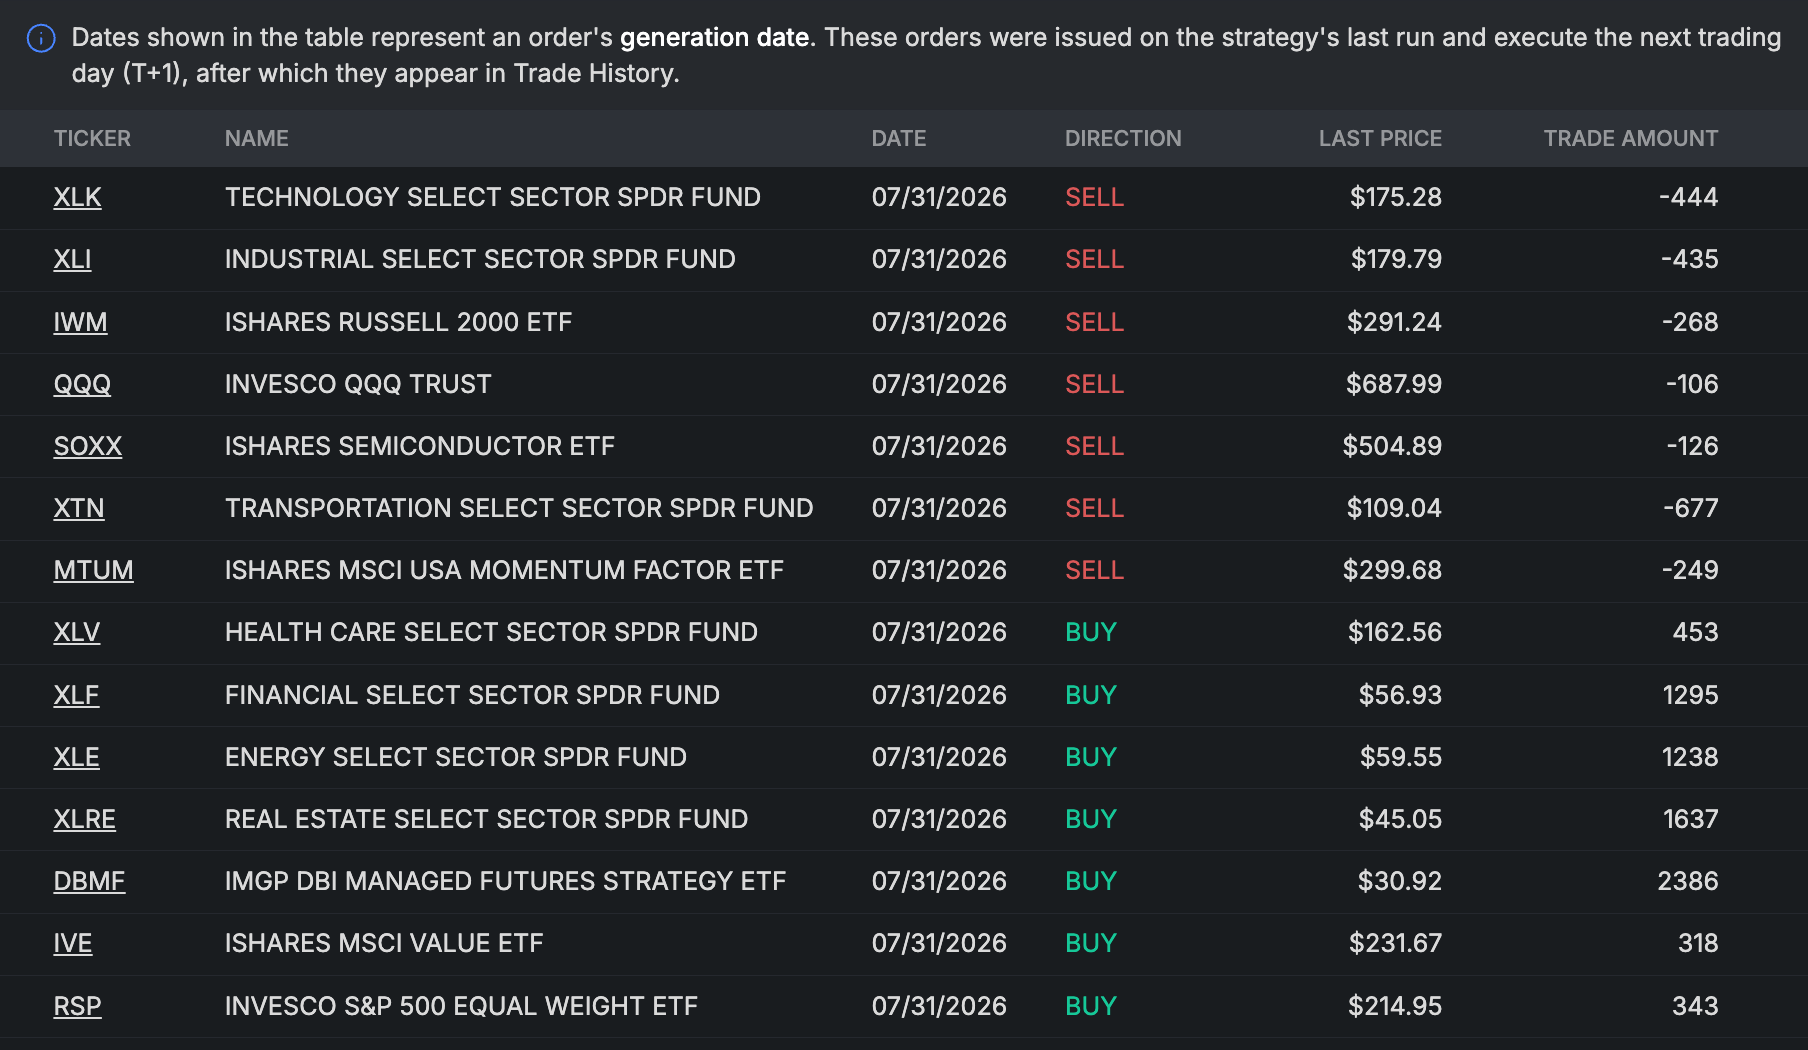
Speaking of which, let’s take a look at the trade list for our ETF focused Strategy — Vigilant Asset Allocation. This model rebalances once per month and rotates between a list of Sector and Factor ETFs. Right now, it’s selling Tech (XLK), small caps (IWM), the Nasdaq (QQQ), Semiconductors and Momentum in favor of Healthcare (XLV), Financials (XLF), Energy (XLE), Value Stocks (IVE) and the Equally Weighted S&P500 (RSP).
Of course, these trades would have been ideal to execute at the start of July, since most of the price move has already panned out. As such, for now, this only serves as an exercise to see where we could rotate capital once a sizable bounce in Momentum names materializes.
Our Trading Strategy (Sigma Portfolio)
As with many of our automated models, our real life trading portfolio is experiencing a larger than normal drawdown at the moment. The defensive measures we have already taken (reducing allocation to stocks and raising cash) have certainly helped mitigate the downside to a certain extent, but were not exactly “enough”.
That being said, markets don’t move in a single direction all at once. Every bear market has vicious counter trend rallies that give agile investors better opportunities to rebalance risk. In our opinion, most of the forced selling is already behind us. As such, further selling of momentum related names doesn’t really make sense right now, especially since a counter-trade has good odds of happening over the next month.
However, this is not a green light to buy the dip. We’d need to reassess the entire situation one month from now, once fundamentals start to trickle through our ranking system and rotate the selection list. The good news is that for the most part, fundamentals of the AI trade have been holding up well. Hyperscaler CAPEX remains robust, and several companies’ balance sheets already show evidence that their AI buildouts are generating returns.
History says that a bounce is not a bottom. For example, one month after the dot-com high, the SOX had dropped -35%. It then surged about +37% yet still reached up to test its 200-day moving average. As of Thursday’s close, semiconductors were -23.0% below the June 22 peak, -11.1% beneath the 50-day moving average, but remained +25.6% above the 200-day. June’s trapped longs don’t exit on the first down day. They sell into the first rally that brings them near breakeven.
August and September are seasonally weak months. We could be set up for a tradeable rally that eventually fails. At the moment, we would treat a rally as a better opportunity to reduce risk, rather than add. Once autumn starts, adding exposure again should start making more sense.
Disclosures / Disclaimers: This is not a solicitation to buy, sell, or otherwise transact any stock or its derivatives. Nor should it be construed as an endorsement of any particular investment or opinion of the stock’s current or future price. To be clear, I do not encourage or recommend for anyone to follow my lead on this or any other stocks, since I may enter, exit, or reverse a position at any time without notice, regardless of the facts or perceived implications of this blog post. I currently do not own or plan to own any position, long or short, in the securities mentioned.
I am not a financial advisor licensed in the United States. Nor am I providing any recommendations, price targets, or opinions about valuation regarding the companies discussed herein. Any disclosures regarding my holdings are true as of the time this article is written, but subject to change without notice. I frequently trade my positions, often on an intraday basis. Thus, it is possible that I might be buying and/or selling the securities mentioned herein and/or its derivative at any time, regardless of (and possibly contrary to) the content of this blog post.
I undertake no responsibility to update my disclosures and they may therefore be inaccurate thereafter. Likewise, any opinions are as of the date of publication, and are subject to change without notice and may not be updated. I believe that the sources of information I use are accurate but there can be no assurance that they are. All investments carry the risk of loss and the securities mentioned herein may entail a high level of risk. Investors considering an investment should perform their own research and consult with a qualified investment professional.
I wrote this blog post myself, and it expresses my own opinions. I do not have a business relationship with any company whose stock is mentioned in this blog post. The information in this blog post is for informational purposes only and should not be regarded as investment advice or as a recommendation regarding any particular security or course of action.
The primary purpose of this blog post is to share industry expertise and research and receive feedback (confirmation / refutation) regarding my investment theses.