/ July 20 / Weekly Preview
-
Monday:
N/A
---
Tuesday:
N/A
---
Wednesday:
N/A
---
Thursday:
Initial Jobless Claims (212K exp.)
---
Friday:
New Home Sales (0.61M exp.)
-
Monday:
Zions Bancorporation N.A.
---
Tuesday:
The Charles Schwab Corporation
Interactive Brokers Group, Inc.
---
Wednesday:
Alphabet Inc.
Tesla, Inc.
Philip Morris International Inc
Texas Instruments Incorporated
ServiceNow, Inc.
---
Thursday:
Intel Corporation
RTX Corporation
SAP SE
Lockheed Martin Corporation
Newmont Corporation
---
Friday:
American Express Company
NextEra Energy, Inc.
Verizon Communications Inc.
HCA Healthcare, Inc.
The Momentum Meltdown
We will be on break between July 27 and August 02. Our next Preview article will be published on Monday, August 03, 2026.
Got a question about the markets, your investments, or a topic you’d like us to discuss in an upcoming article? We read every message and may feature your question in our daily write-ups!
Email: andrei@signal-sigma.com
Follow & DM on X: @signal_sigma
Glancing at the headline figure for the S&P 500's weekly change might suggest we went through a dull week, but in reality it was far, far from uneventful. The S&P 500 fell roughly -1.5% to finish at 7,457.69, the Nasdaq 100 declined about -4%, while the Dow held up with a fractional loss.
Beneath the surface, the most crowded trade on the planet came apart. Goldman Sachs’ high-beta momentum basket lost ~ 24% month-to-date through mid‑July, marking its worst run since April 2009. Morgan Stanley’s tech momentum index recorded a 17‑day rate of change of −35%, the weakest reading in the 27 years that desk has monitored it. Our own models took a major hit as well. Millennium Alpha is down -14.7%, Momentum lost -19.9% and Vision’s current drawdown sits at -10.5%. These are some of the worst drawdown readings outside of full blown bear markets.
Several catalysts were to blame.
China’s Moonshot AI released Kimi K3, an open-weight LLM with 2.8 trillion parameters. Benchmarks show K3 performs near top-tier U.S. systems while being far cheaper to run, challenging the assumption that U.S. models hold a lasting performance and cost advantage. As a result, chipmaker stocks bore the brunt of losses, with the Philadelphia Semiconductor Index now close to an official bear market (-20% decline). Most key stocks from the sector are showing losses exceeding their own 5-Year median drawdowns.
The macro tape was also antagonistic to risk taking. Oil lit up +14% on renewed strikes between the US and Iran. As a result, Energy (XLE) was by far the best performer among major Sectors on the week. Real estate, staples, and financials also finished green as yields fell on soft inflation readings. By far the highest damage was concentrated in one corner of the market — namely Tech (XLK), which lost -5.5%.
Cross asset markets told the same story. Gold fell -2%, silver lost -6%, while yields and the US Dollar were stable. On the economic data front, the University of Michigan’s preliminary July sentiment reading jumped to 54.4 from 49.5 as gasoline prices cooled earlier in the month.
Overall, we’re not seeing money leave the market. Capital is rotating hard, as investors reposition for the end of the year. SPY closed the week at 743.15, sitting just above its 50-DMA, at the mid-point between resistance at $766 (R1) and support at $731 (M-Trend). The primary up-trend remains fully intact, with just ~2% separating the benchmark ETF from all-time-high values. Near term momentum is neutral, with the 40D stochastic reading sitting at 66/100. This is a market that’s neither overbought, nor oversold.
$731 is the line in the sand for SPY, with a decisive hold above putting the burden of proof on the bears.
Meanwhile, the equal-weight S&P 500 (RSP) lost -0.5% and even hit a new intraday record midweek, while the Russell 2000 outperformed the Nasdaq.
The contrast between SPY and the Momentum Factor ETF (MTUM) is the whole story at the moment. After an unprecedented run which culminated in late June, MTUM collapsed -6% last week and now records one of the largest negative 1-Month relative to SPY returns in history. At -11%, the current performance differential exceeds -3.5 standard deviations and was only matched in early 2021 and near the end of the 2023 bear market. Leveraged products in Asia, particularly 2x single-stock ETFs, forced automatic selling during the initial part of the dip and created a self-reinforcing unwind when marginal buyers failed to show up.
However, this is not a catastrophe. MTUM still tops the YTD return for major factor ETFs in 2026, with a 19.6% return, even after accounting for the recent drop. This is a violent give-back of an enormous gain, not a wealth-destroying collapse. If capital was truly fleeing the market, we would see selling pressure everywhere.
But we don’t see that. The average stock barely flinched. When market leadership collapses, while the median stock does not, the damage is narrow by definition.
All previous instances of similar underperformance resulted in at least a temporary swing in the other direction, favoring MTUM during the next month.
Goldman’s own desk agrees with this. According to them, once the momentum factor drops more than 20% in a month, forward returns have tended to be positive, with a median gains near +4% over the following week and close to +6% over the following month. This would not happen in a straight line, of course, and the key catalyst resides in the earning reports later in the week.
The most notable release is GOOG on Wednesday in our opinion. The AI trade is being underpinned by tremendous amounts of CAPEX spending. The company has guided for about $175 billion in capital spending for 2026. JPMorgan’s desk sees buyside expectations for Google alone in 2027 climbing to $325–$350 billion, significantly above the Street consensus near $250 billion.
If hyperscalers show any hesitation on this spending, chip stocks that rely on it could fall further. Conversely, if they reaffirm strong commitments, the currently washed-out names could finally get a meaningful dip-buying catalyst.
Whether the trillion dollar AI buildout will ever pay off is a different question. Ed Yardeni has described the broader market mood as “AI Fatigue”. Flash PMIs on Friday will offer the first read on how business activity weathered July’s volatility and the recent oil spike. Everything else revolves around Wednesday night’s Alphabet earnings. A strong, clean capex message from the company would steady the entire AI complex, while any hesitation or wobble could trigger a second leg down in the momentum meltdown.
Semiconductors themselves have returned to a more favorable risk / reward setup according to the options market. Long term upside is now higher than it has ever been over the past year, while downside (the one metric that truly matters) has normalized after the spike in late June.
Seasonality is mixed. Q3 is the most volatile period of the year historically, especially with the added complexity of mid-term elections which are coming up. The 14% recent gains in oil are adding to the Fed’s headaches. Kevin Warsh told Congress the Fed has “no tolerance for persistently elevated inflation.” but refused to elaborate on guidance.
June CPI actually showed prices falling -0.4% on the month, and yet the committee is still split on the odds of a rate hike in September, not a cut. In our opinion, a hike would constitute an unforced error from the Fed, as the US consumer does not appear to be in the best shape ever, especially at the low and mid-end of the wealth spectrum.
Here’s the catch: the market’s most growth oriented stocks, sporting the highest valuations, need an environment of falling rates coupled with economic strength and policy certainty. Otherwise, the trade is not going to work out, irrespective of the underlying business — simply because of the shift in valuations that such an environment imposes.
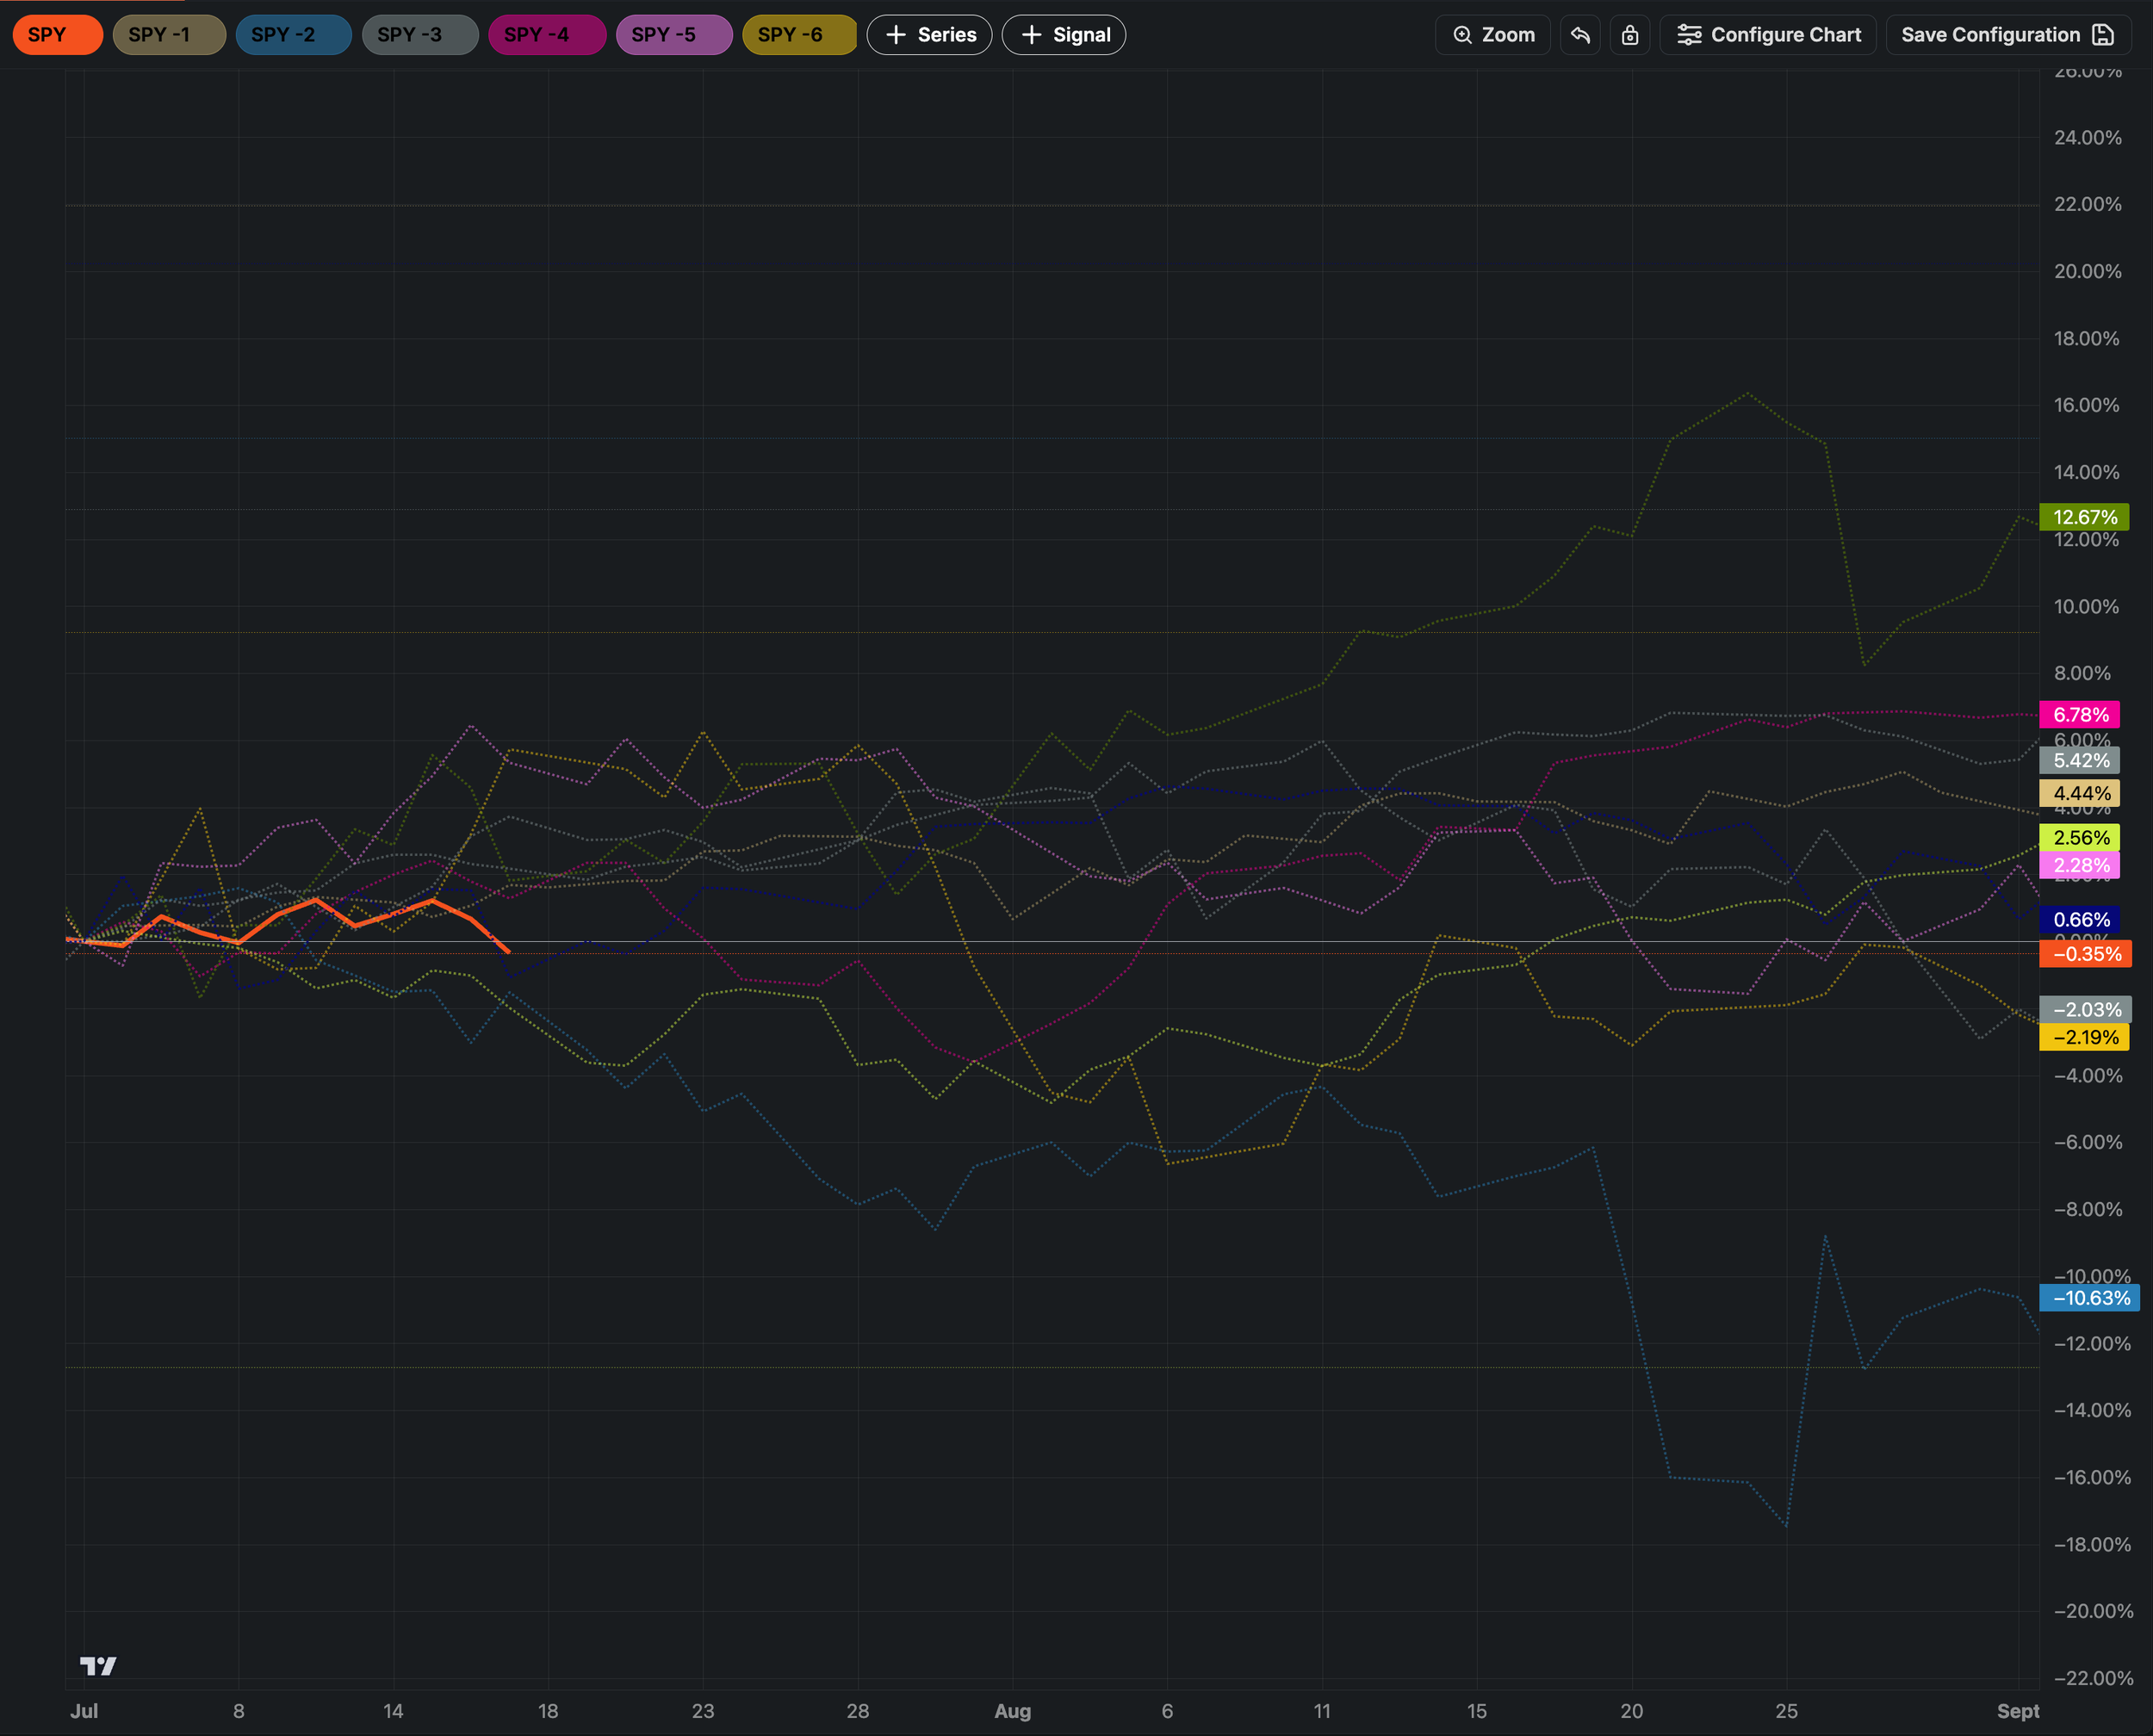
Over the last decade, SPY returns ranged from +12.6% to -10.6% in the 3 months ahead, with a median gain of +2.35%.
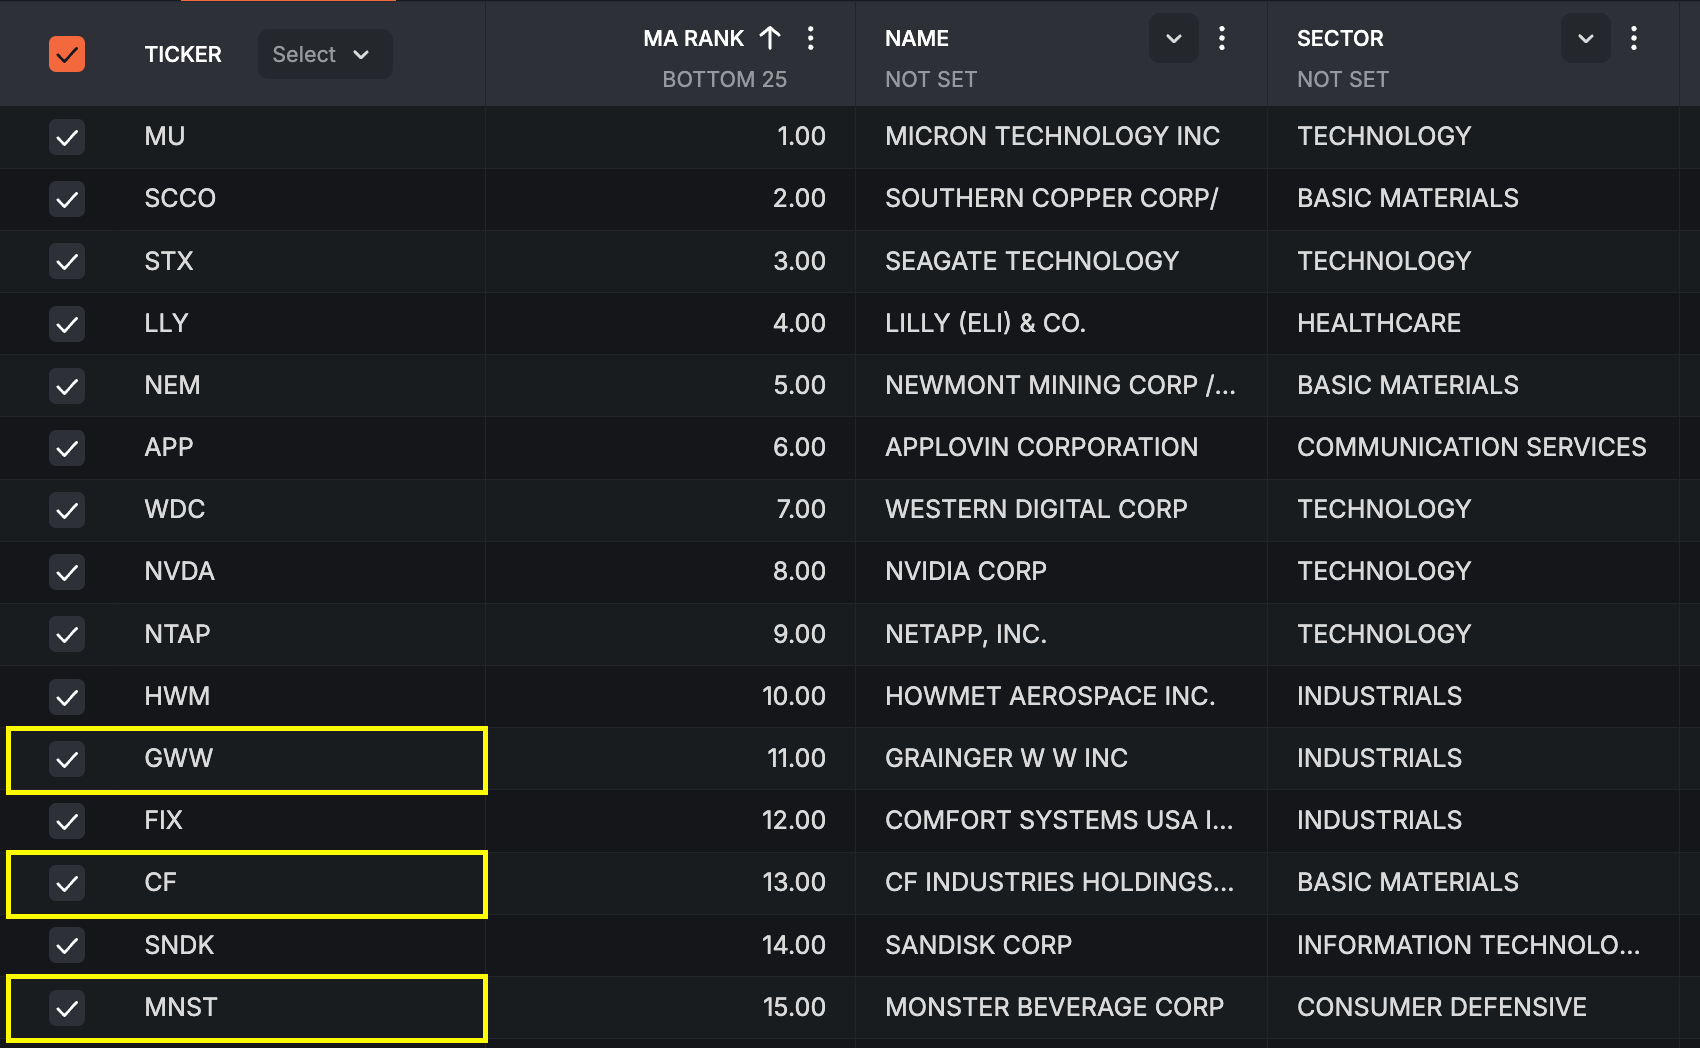
Fans of the Millennium Alpha system may be asking when our top 15 ranking will start to meaningfully shift away from the AI trade. And the answer is that a full rotation of the ranking takes several months to play out. NVDA is still part of the top 15, after several years of constant inclusion for example.
Our ranking model is primarily driven by fundamentals, not technicals, and the entire Q2 reporting period needs to play out first. Meanwhile, a different kind of stock is quietly ranking higher: an industrial company like GRAINGER INC, a fertilizer play like CF Industries and the top pick from the consumer staples complex — Monster Beverage.
These stocks recently replaced picks such as APPLIED MATERIALS, KLA TENCOR and LAM RESEARCH, which held spots in the top 15 during the past 6 months and were beneficiaries of the momentum driven AI rally.
Our Trading Strategy (Sigma Portfolio)
With our Enterprise model signaling restraint, capital preservation is the top priority at the moment. The market is still digesting the meltdown in momentum names, which may have more room to run. The rotation is healthy but not finished.
With an incredible amount of negative GEX now concentrated in the semiconductor complex, we may also see face-ripping rallies in the weeks ahead. Markets rarely move in a straight line and negative GEX amplifies moves both to the downside as well as to the upside.
This week’s reports will tell us if momentum names have found a floor, at least from a fundamental perspective. If Alphabet and others confirm the CAPEX spend, we might as well see a momentum snapback. But even in such a case, we would not be chasing.
Instead, we will let the earnings do the talking. Our ranking system will pick up the winners once fundamentals get reported and incorporated into our database. If there is disappointment on this side, we will most likely reduce exposure to the AI trade even more. In any case, the defensive action we have taken last Tuesday certainly helped. Discipline is the name of the game right now, as it is a critical ingredient to navigating markets in times like these.
Disclosures / Disclaimers: This is not a solicitation to buy, sell, or otherwise transact any stock or its derivatives. Nor should it be construed as an endorsement of any particular investment or opinion of the stock’s current or future price. To be clear, I do not encourage or recommend for anyone to follow my lead on this or any other stocks, since I may enter, exit, or reverse a position at any time without notice, regardless of the facts or perceived implications of this blog post. I currently do not own or plan to own any position, long or short, in the securities mentioned.
I am not a financial advisor licensed in the United States. Nor am I providing any recommendations, price targets, or opinions about valuation regarding the companies discussed herein. Any disclosures regarding my holdings are true as of the time this article is written, but subject to change without notice. I frequently trade my positions, often on an intraday basis. Thus, it is possible that I might be buying and/or selling the securities mentioned herein and/or its derivative at any time, regardless of (and possibly contrary to) the content of this blog post.
I undertake no responsibility to update my disclosures and they may therefore be inaccurate thereafter. Likewise, any opinions are as of the date of publication, and are subject to change without notice and may not be updated. I believe that the sources of information I use are accurate but there can be no assurance that they are. All investments carry the risk of loss and the securities mentioned herein may entail a high level of risk. Investors considering an investment should perform their own research and consult with a qualified investment professional.
I wrote this blog post myself, and it expresses my own opinions. I do not have a business relationship with any company whose stock is mentioned in this blog post. The information in this blog post is for informational purposes only and should not be regarded as investment advice or as a recommendation regarding any particular security or course of action.
The primary purpose of this blog post is to share industry expertise and research and receive feedback (confirmation / refutation) regarding my investment theses.