Fundamental Screener
These options will let you configure up to 152 metrics on 7 columns in the screener table. You can get more info on a particular stock, see a scatter plot of the first two columns, or visualize a combined chart from the prices of the screener output.
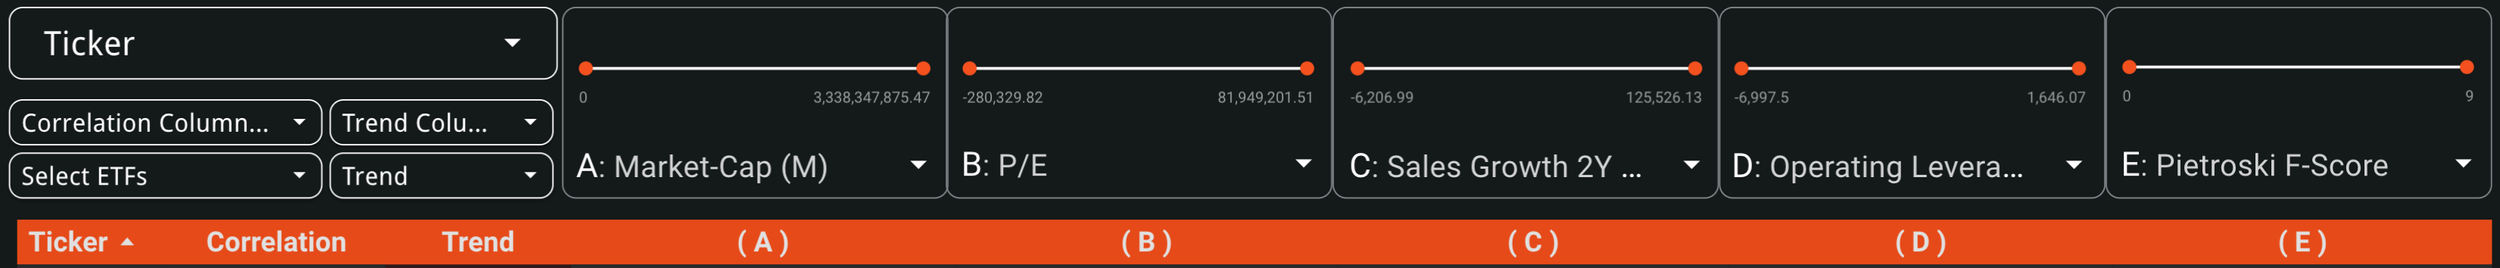
Select this to have Sector ETFs as column headers and display correlation to each (just like the screenshot above)
Select this to have Factor ETFs as column headers and display correlation to each (ex: instead of XLK, you would have QQQ)
Ranking System
Define importance scores for a set of fundamental variables, and our system will rank the stock universe accordingly. This logic powers all Millennium Strategies. Factor Returns allows you to see the correlation between metrics and performance on various time horizons.

You can also use filters to drill down into economic activity or ETF correlation, for a more focused ranking.
Correlation Screeners
These options will let you screen exclusively based on Sector or Factor correlations. Very useful for inputting your own portfolio and understanding your true diversification (this function is also available in the Portfolio Tracker to avoid having to input your portfolio every time) .

Risk Explorer
This screener type will show you (in percentage terms) the price move available for each stock to a commonly used reference point - like the 200-Day Moving Average. Very useful for inputting your portfolio and understanding statistical risk (this function is also available in the Portfolio Tracker to avoid having to input your portfolio every time) .

Select this to screen using a combination of fundamental and technical data. You can also input your own portfolio and gain insights into your stocks.
Screener Presets
Start using the Stock Screener using our pre-built screening methods. In this mode, certain parameters are locked so that the desired filtering is produced. Alternatively, configure your own custom screener using the Manual Configuration.
Momentum + Quality
This Stock Screener works by selecting a couple of meaningful technical indicators and coupling them with a high Piotroski F-Score.
The following Parameters are Locked :
Piotroski F Score => 6; this ensures Quality
6 month & 1 Year Absolute Returns > 0; a basic momentum requirement
Sharpe Ratio > 1; very favorable risk-reward
Z-Relative > 0; stock outperforms its benchmark ETF
You can still use the screener to filter or sort the table according to your requirements.
Beaten Up + Quality
This Stock Screener works by selecting stocks that have declined more than 50% from their recent All Time Highs, but still maintain quality fundamentals as measured via the Pietroski F-Score.
The following Parameters are Locked :
Piotroski F Score => 6; this ensures the “Quality” component
Current Drawdown of 50% or more from All Time High; this represents the “Beaten Up” component
You can still use the screener to filter or sort the table according to your requirements.
Tomorrow’s Winners
This Stock Screener works on the assumption that we filter for currently unprofitable companies, that are investing a significant portion of their profits in R&D and also have a great operating model.
The following Parameters are Locked :
EBITDA < 0; currently, the company is NOT profitable
R&D / Gross Profit 2YR Average > 25%; at least one quarter of gross profits have been invested in R&D on average in the past 2 years
Operating Leverage Mean > 1; this ensures that for every percentage point of revenue increase, EPS will increase by at least 1% - proves a great business model
You can still use the screener to filter or sort the table according to your requirements.
Buy The Dip Opportunities
This Stock Screener works by selecting stocks that are trending up longer term, but are currently trading below their 50-day Moving Average, while still outperforming their benchmark ETF.
The following Parameters are Locked :
Regression Trend is Positive; the stock is trending up, on a 2 year historical window
Sigma 50 < 0; currently, the stock is trading below the level where it’s normally been trading relative to its 50-day Moving Average
Z-Relative > 0; the stock is outperforming its benchmark ETF
You can still use the screener to filter or sort the table according to your requirements.
Screener Help & Tutorial
The Stock Screener is a highly complex tool. It comes with a built-in user guide, accessible from the button above, which you are encouraged to visit. Rather than cover all of the basics and intricacies here, this quick guide will focus on the less known PRO-TIPS:
ENABLE FULL - SCREEN MODE: accessible from the bottom-right button;
SORT THE TABLE by clicking on the header column;
EXPORT SCREENER to .csv or Google Docs: simply right-click anywhere and select option;
Try using “,” instead of “.” when inputting floating point numbers if screener is empty.
The lower part of the instrument shows a visualization according to the screener type. By choosing Chart Screener from this menu, you will be able to view an equal weight equity curve comprised of all of the instruments included in the screener.
Screener Help & Tutorial
The Stock Screener is a highly complex tool, which is not available on mobile.
Please access this instrument through our Desktop interface.
It comes with a built-in user guide, which you are encouraged to visit. Rather than cover all of the basics and intricacies here, this quick guide will focus on the less known PRO-TIPS:
ENABLE FULL - SCREEN MODE: accessible from the bottom-right button;
SORT THE TABLE by clicking on the header column;
EXPORT SCREENER to .csv or Google Docs: simply right-click anywhere and select option;
Try using “,” instead of “.” when inputting floating point numbers if screener is empty.
The lower part of the instrument shows a visualization according to the screener type. By choosing Chart Screener from this menu, you will be able to view an equal weight equity curve comprised of all of the instruments included in the screener.